Weekly Market Outlook – The Recovery Effort Was Impressive, But Not Decisive
Weekly Market Outlook – October 6th, 2019
In retrospect, there was nothing particularly surprising about last week’s recovery move. Yes, headlines sent the market lower early in the week and then higher beginning on Thursday. The S&P 500 was likely to turn around anyway; the headlines merely mirrored the shift in trader sentiment.
The key was the floor that connected all the daily lows from August, plotted as a blue dashed line on the daily chart below. All it took was one kiss of that technical support to spark the bounce. Also notice the VIX bumped into a fairly well established technical ceiling right around 22.0. It’s marked in purple.
S&P 500 Daily Chart, with VIX, Volume
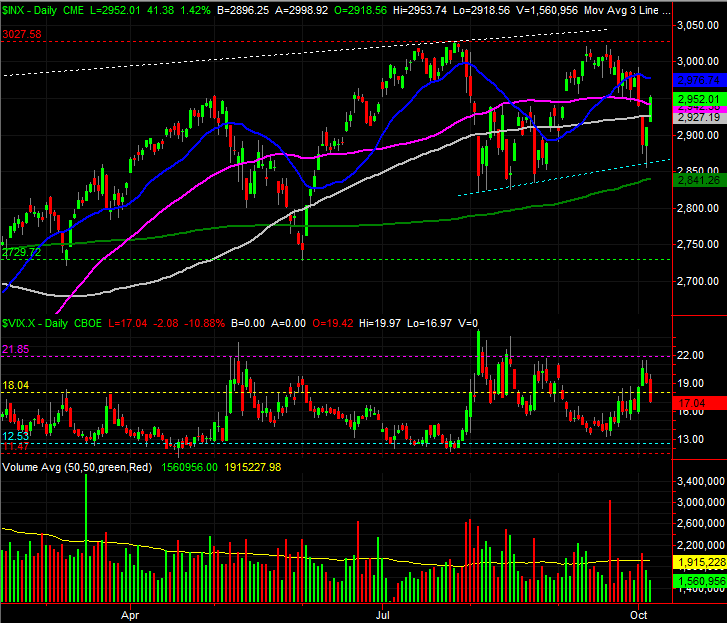
Source: TradeStation
Friday’s strong move pushed the index back above the 100-day (gray) and the 50-day (purple) moving average lines… another encouraging clue.
There are still some challenges for the bulls looking to cast a perfectly bullish light on the effort though. Chief among them the lack of volume behind the rebound effort. Some of that could have had something to do with the approaching weekend, though not all of it. Also, although the S&P 500 finished strong, the market failed to make a higher high in September. It may be a subtle clue that the big rally during the first half of the year is running out of gas. The 50-day moving average line? It’s now sloping downward, jibing with another MACD crossunder that’s taken shape below the level where August’s crossunder occurred.
S&P 500 Weekly Chart, with VIX, Volume
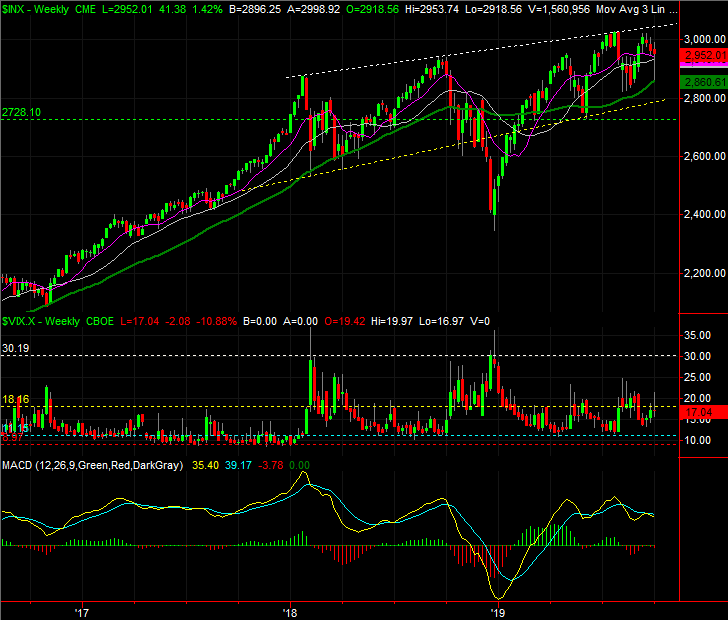
Source: TradeStation
Even without the decidedly bearish momentum clues though, a visual inspection of the weekly chart indicates the momentum has been slowing since January.
The same basic story applies to the NASDAQ Composite’s daily chart, though with one added nuance — the NASDAQ perfectly kissed its 200-day moving average line (green) at 7719.7 and then recovered on Thursday.
NASDAQ Composite Daily Chart, with VIX, Volume
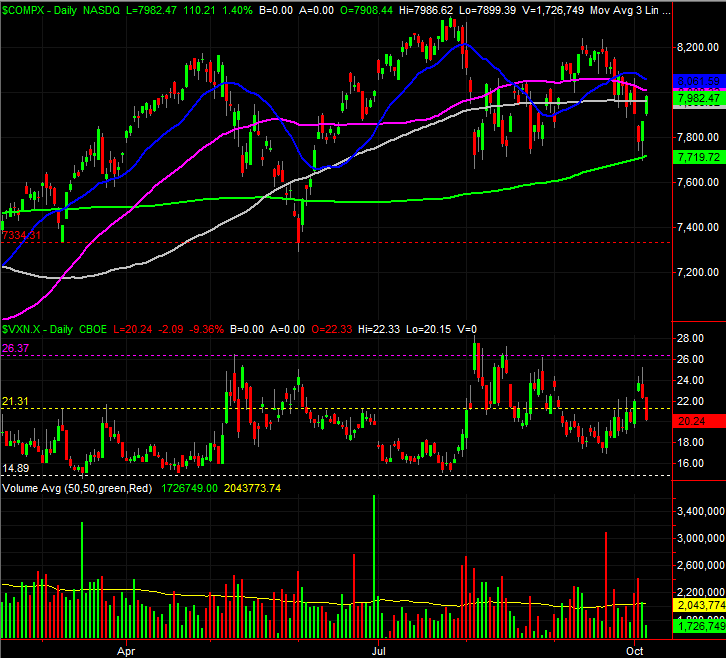
Source: TradeStation
Maybe it was just a coincidence. But, the market usually doesn’t dish out such near-perfect coincidences.
On that note, though on the fence, the market is even less healthy than it may seem.
Yes, the NASDAQ may be above its 200-day moving average line, which is certainly a plus for stocks. Most of the NASDAQ’s stocks, however, are actually well below their 200-day average. Only 42.3% of the composite’s stocks are above their 200-day lines; a few of the biggest are carrying all the weight, and then some. Even fewer — only 39.6% — of the NASDAQ’s stocks are above their 50-day moving average.
NASDAQ Stocks Above 50, 200-day Moving Average Lines
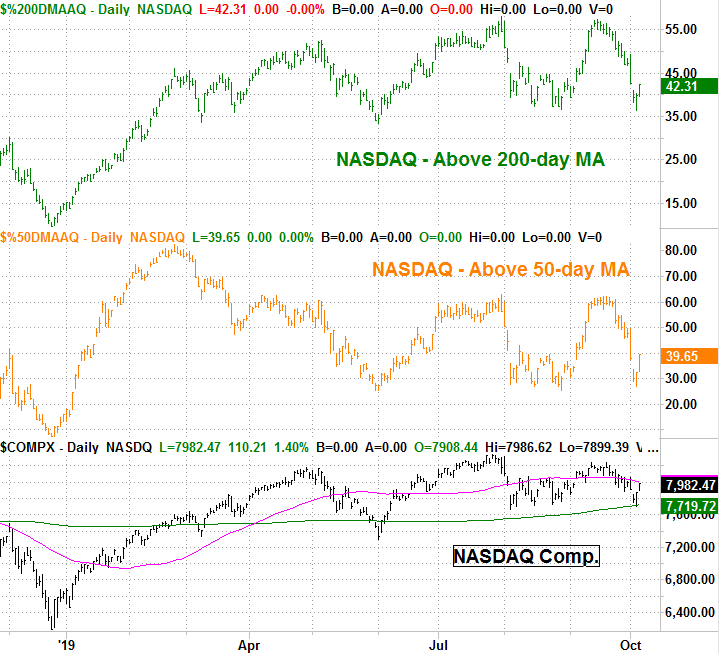
Source: TradeStation
The S&P 500’s stocks aren’t in the same problematic boat; 62% of its stocks are above their 200-day moving average line. But, the NASDAQ tends to lead the market, higher and lower.
With all of that being said, the 200-day moving average line is the absolute floor here, while the S&P 500′ recently-developed ceiling near 3027 is a make-or-break resistance level. Things are heading into a showdown, and the odds of a breakout appear to be about the same as the odds of a breakdown. This month’s trade negotiations could finally force the bulls and/or the bears to make a more prolonged commitment.