Weekly Market Outlook – Dangerous Lack of Fear, or Just Rock-Solid Bullishness?
As of the most recent numbers, the S&P 500 is valued at a trailing P/E of 19.16 and a forward-looking P/E of 17.0, thanks to the incredible rally since late December. The trailing figure isn’t as high as it was for the better part of 2016, 2017 and 2018, but it remains above the long-term norm. The projected valuation also suggests investors are counting on future earnings that may be a little better than currently expected.
S&P 500 EPS, P/E Chart
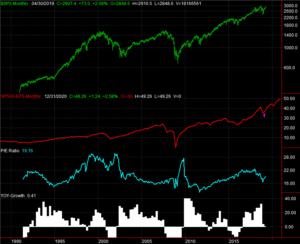
Source: TradeStation
That’s a somewhat risky bet, given that earnings haven’t lived up to expectations from six months out (and longer) for several years now.
That’s not a guarantee of a pullback now. We’ve seen the market’s valuation ceiling reach and hold at 22.0 for long periods of time. The S&P 500 could reach 3338 before valuation becomes an overwhelming problem. Still, there’s room and reason to expect a pullback given how overbought the market is here.
The weekly chart of the S&P 500 puts things in perspective. The past sixteen weeks have been amazing, but not especially well-paced. They’re also rooted in unhealthy levels of confidence. The VIX is now at a semi-major floor at 11.1 (though the absolute floor at 11.5 has yet to be touched. The VIX could make its way all the way to that support before the rally just completely runs out of support, but it doesn’t have to happen that way.
S&P 500 Weekly Chart, with Volume
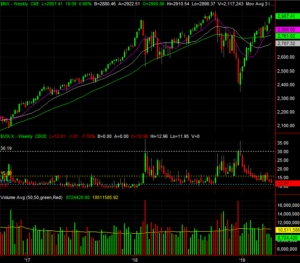
Source: TradeStation
Notice also that while the market may be rising, the volume behind the rally continues to wane. Investors are increasingly afraid to buy the higher stocks go, even though that doesn’t jibe with the ever-falling VIX.
The same basic story applies to the NASDAQ and the VXN.
NASDAQ Composite Weekly Chart, with Volume
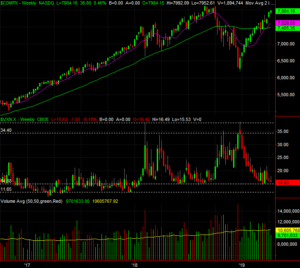
Source: TradeStation
Zooming into the daily chart of the S&P 500 doesn’t actually show us a whole lot more, but it does make one matter clear enough – even with Friday’s surge, the momentum is slowing. That tends to happen at this point. The S&P 500 is now 5.2% above its 200-day moving average line (green). In early October, it was just a bit under 6% above the 200-day line. We’re near yet-another absolute/extreme in terms of how far the market can go before running into a wall.
S&P 500 Daily Chart, with Volume
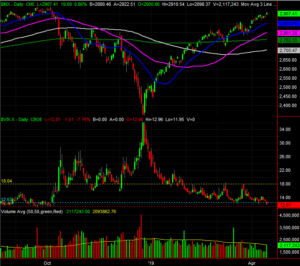
Source: TradeStation
Frustratingly, there’s no amount or kind of technical analysis here that can supersede or override the fact the market remains hijacked by sentiment, which changes every day in response to headlines. Investors only care about valuation and traders only care about the technical situation when they want to. When either group really wants to latch onto a bullish or bearish argument based on news developments though, that’s what they’re going to do.
The odds of downside are greater than odds of more upside, but that doesn’t necessarily mean any weakness will take shape now. And, there’s no clarity as to where any pullback might stop. Any of the four moving average lines could act as support.
More than anything, keep an eye on the VIX and the volume data. Namely, should the VIX break above resistance at 18.0, that’s likely to be the beginning of more serious weakness that would ideally coincide with a break (or breaks) below the aforementioned moving averages.
This remains a day-to-day dance. Assume nothing.
-Price