Weekly Market Outlook – This Oddly Persistent Rally Isn’t Unheard Of
Weekly Market Outlook – December 29th, 2019
This week’s analysis once again starts with the bigger-picture weekly chart of the S&P 500, just to set the stage appropriately. Thanks to last week’s 0.6% advance, the index is now up nearly 10% from its October low. We’ve seen more meteoric, unfettered rallies, but they’re a rarity. And, just for the record, the S&P 500 is now 8.8% above its 200-day moving average line (white). That’s somewhere around the very extreme end of its typical divergence. In early 2018, the index reached 13.3% above its 200-day line, but that was an even more extreme scenario in that 2017’s rally was also uninterrupted for so long.
S&P 500 Weekly Chart, with VIX and RSI
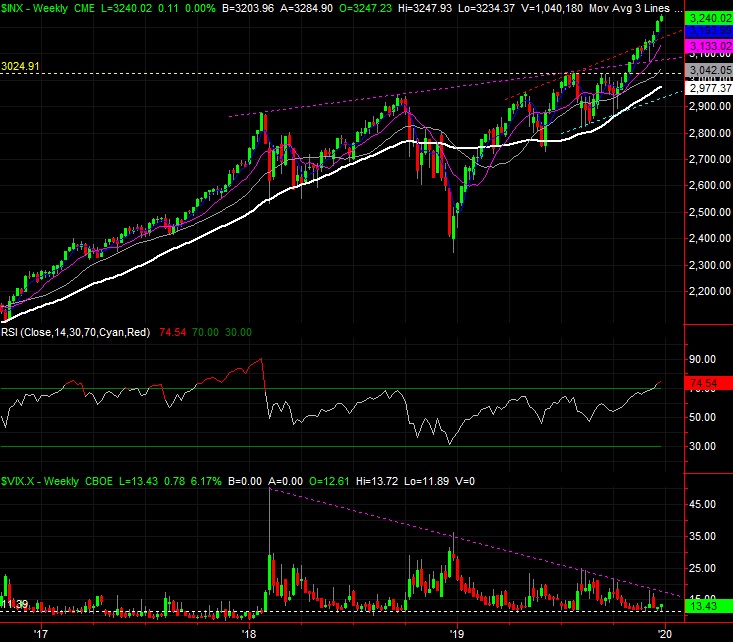
Source: TradeStation
Still, it’s that 2017 rally that should serve as a reminder that anything’s possible. The market doesn’t “feel right,” but how things feel isn’t exactly the point. Follow the momentum until it’s clear the momentum has reversed course.
To that end, we’re still looking for one of two (if not both) clues that the tide has truly taken a bearish turn. One of them is a move below the 20-day moving average line at 3170, plotted in blue on the daily chart below. The other is still the VIX breaking above the falling resistance line that’s guided it lower since it peaked in early 2018. That ceiling is plotted in purple on both charts.
S&P 500 Daily Chart, with VIX and Volume

Source: TradeStation
Just for good measure, a look at the weekly chart of the NASDAQ Composite, and the VXN. Curiously, it’s now trading 10.7% above its 200-day moving average line, versus its early-2018 divergence of 13.2%. Never say never, particularly when we’re transitioning into a new year. Sometimes investors have some preconceived notions in their heads that they’re going to ensure pan out, whether or not they make sense.
NASDAQ Composite Weekly Chart, with VXN
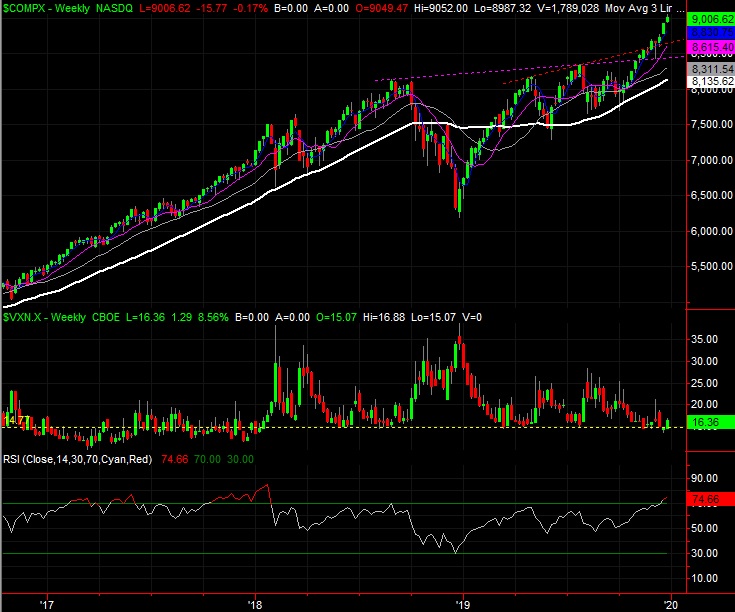
Source: TradeStation
Of course, it never hurts to be prepared for a sharp reversal. We know one is coming sooner or later. The same basic red flags that apply to the S&P 500 apply to the NASDAQ as well.
With all of that being said, the year may not be technically over yet, but practically, it is. It’s time to take a look back and see how it took shape. As they say, read ’em and weep. The image below tells the tale. Thanks to a harrowing end to 2018 setting up a fairly easy rebound rally in 2019, the S&P 500 managed to dish out a 29.2% gain for the now-ending calendar year. That’s one of the best for the past forty years.
S&P 500 Progressive Annual Performance vs. Average
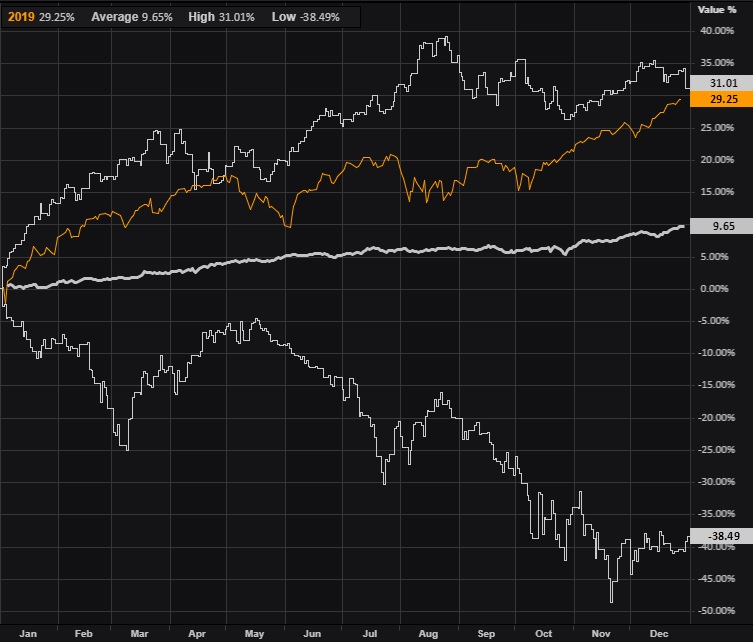
Source: Thomson Reuters
On that note, be aware that January is usually a bullish month, and does particularly well early in the month. We already know there’s room for more upside. Just be careful about assuming history repeats itself. On the flipside, don’t ignore historical tendencies. Whatever’s in the cards, just keep in mind that the beginning of a new year will lead traders to conclusions that may or may not be merited. Tread lightly.