Weekly Market Outlook – January 19th, 2020
To say “the market’s moving higher because stocks are rising” sound ridiculous on the surface. Yet, it’s actually an accurate assessment of what’s in play. But, first things first.
We’ll begin this week’s analysis a with a broad look at the weekly chart of the S&P 500, just to put the scope of the rally since October in perspective. This has all been highly unusual, though the bulls remain unwilling to yield. As the same chart also cautions though, such rallies can stop and turn on a dime and unwind in a big way.
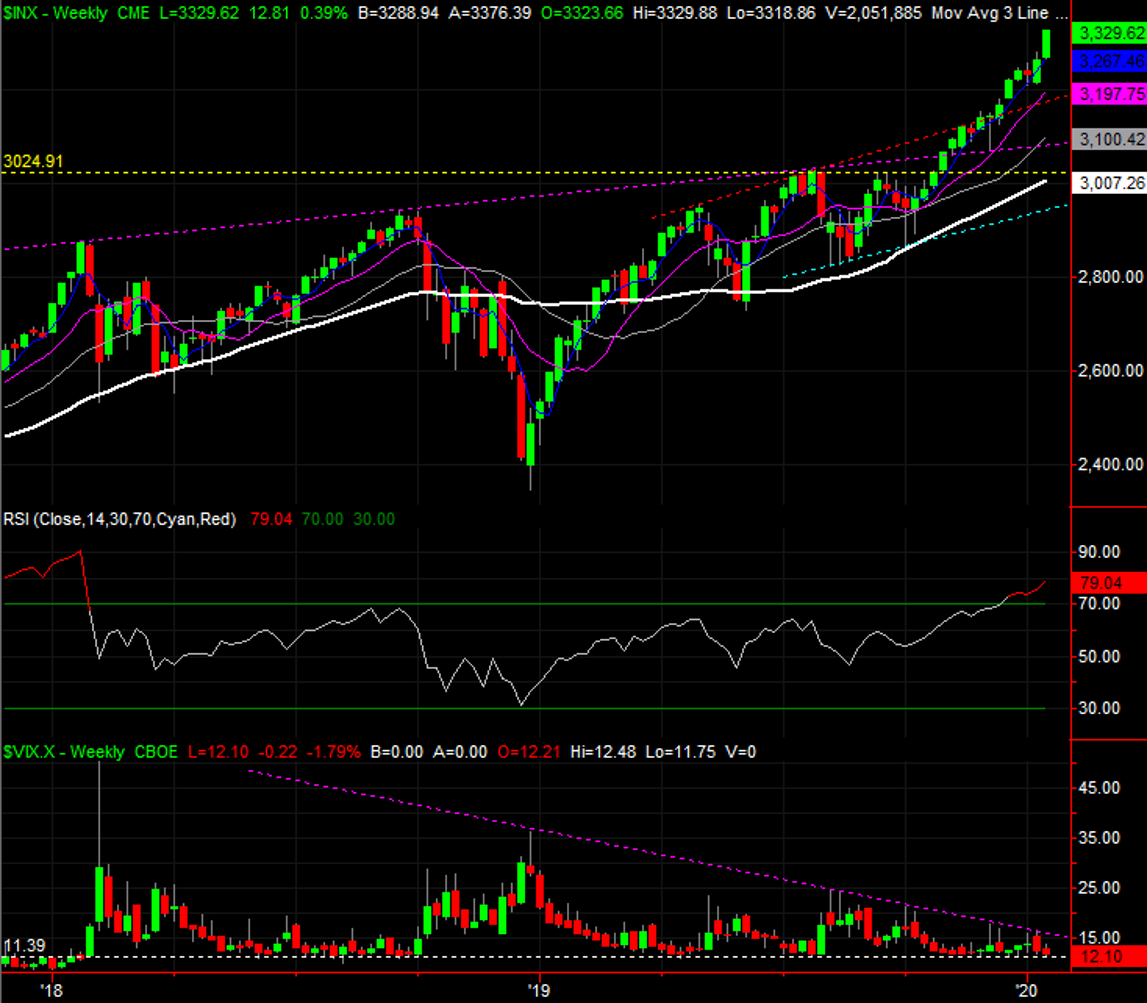
Source: TradeStation
Same story for the NASDAQ Composite, though more intensely. With last week’s 2.3% advance, the tech-heavy composite is now up a whopping 22% from its October low. That’s an extreme in more ways than one, not the least of which is the degree of divergence from its 200-day moving average line (white) at 8234. It’s now 14% above the long-term indicator. For comparison, it never got more than 15% above its 200-day average in 2018… when it was on a major roll.
NASDAQ Composite Weekly Chart, with VXN and RSI
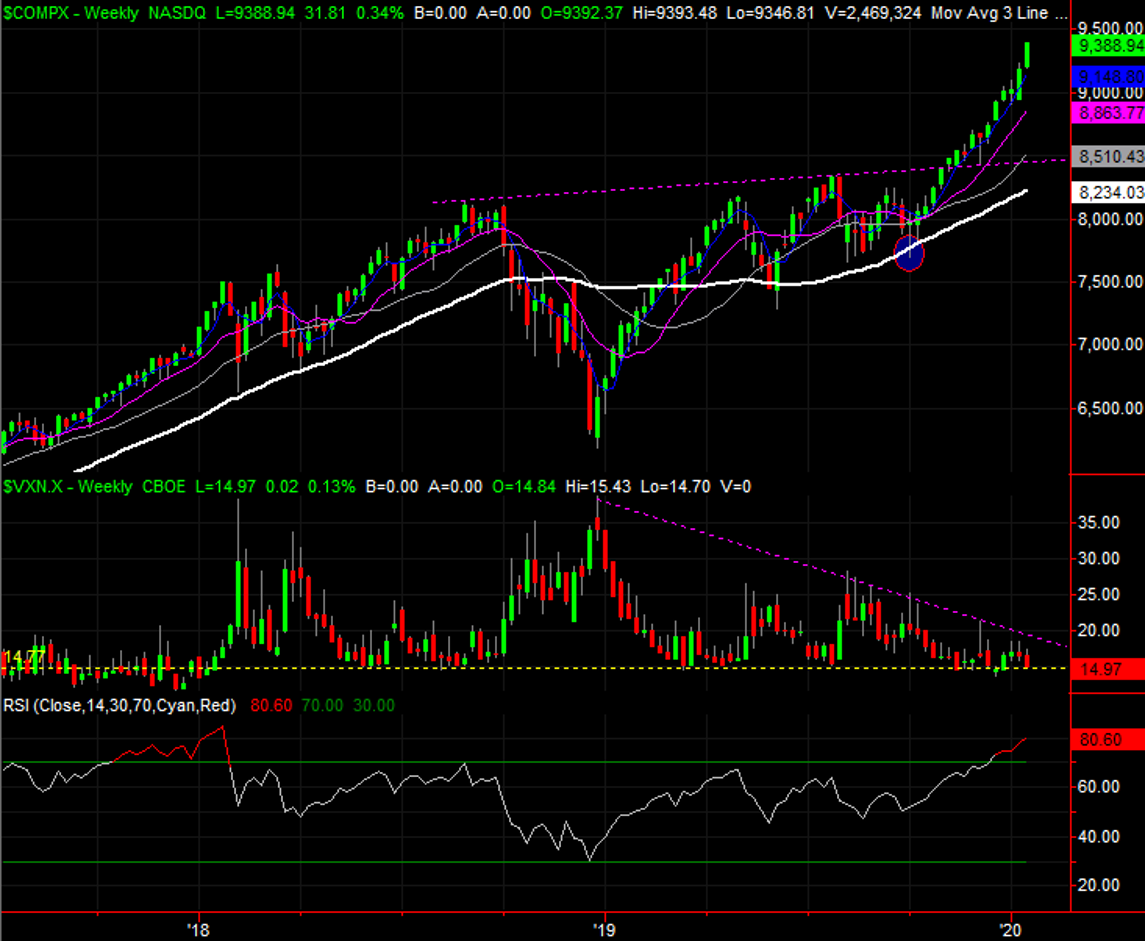
Source: TradeStation
Also note the NASDAQ’s volatility index, the VXN, has fallen back to what’s become a pretty strong support area just under 15.0. That doesn’t necessarily mean a correction is imminent. The VXN could simply waffle around its current levels while the market continues to inch higher, as we saw happen in the middle of 2018. In the same vein, just because the market is overbought doesn’t inherently mean it has to pull back now. It’s been overbought for a while, and hasn’t stopped yet.
Just for the record though, each day the march forward continues is another day that takes shape against ever-worsening odds.
To that end, a zoomed-in view of the daily charts make it fairly clear what will serve as an official signal that the overdue correction has begun. For the S&P 500, it will have to start with a break below the 20-day moving average line (blue) currently at 3254. Anything less than that, and we still have to give the benefit of the doubt to the bulls. And even then, a tumble below the 50-day moving average line (purple) will be necessary to confirm more downside is brewing.
Yet, even that won’t necessarily be a major red flag. We’ll still want to see the pivot take shape with a clear, pivotal bar. That is to say, the shape of the bar that comes right before the first big “down” day should be a doji, or what’s often called a spinning top. That’s or at least a huge intraday swing for the worst.
S&P 500 Daily Chart, with VIX and Volume
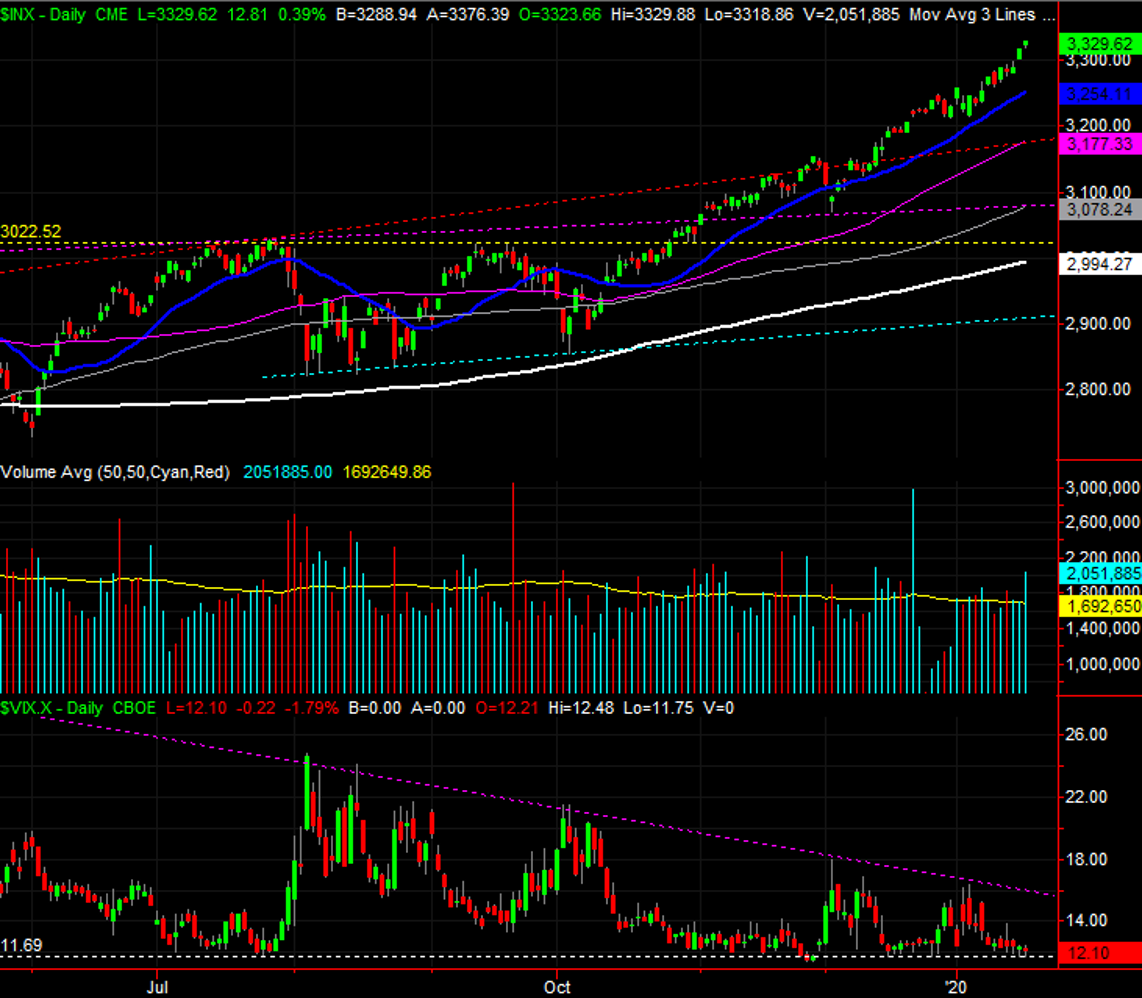
Source: TradeStation
More than anything though, we’re keeping a close eye on the VIX (and VXN) foe evidence that the tide has finally taken a turn for the worst. The market has been kind enough to draw a clear technical ceiling for the VIX (purple, dashed) that will need to be hurdled if stocks are going to stumble into any real trouble. Anything less than that, and even a little weakness may be palatable.
Unfortunately for the market, there’s little wiggle room left between where the VIX is and that ceiling, currently just below 15.0.