Weekly Market Outlook – The Charts Say “Bottom,” But Pros Say Otherwise
Weekly Market Outlook – March 15th, 2020
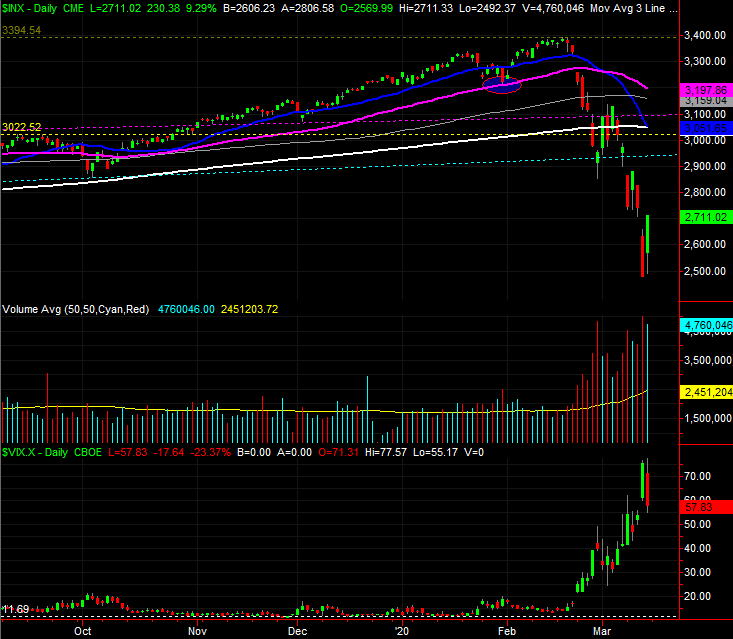
Exhausted yet? It would be surprising if you weren’t. The S&P 500 lost another 8.8% last week, but it was hardly a straight line move. At one point on Thursday the index was off to the tune of 16.5%, translating into a pullback of almost 27% from February’s peak. That’s a bear market, and then some. The daily chart of the S&P 500 puts it all in perspective. Wow.
S&P 500 Daily Chart, with VIX and Volume

Source: TradeStation
The coronavirus craze has taken the market completely off the rails, so to speak, for better or worse. The ‘better’ is arguably the fact that stocks needed a good correction, and got one… the hard way. The ‘worse’ is, the market’s correction could convince consumers that a recession is inevitably, forcing them to (proverbially) hunker down, causing the very recession they fear. That, of course, will put stocks into another leg of downward spiral.
That’s hardly a foregone conclusion though. The sheer severity of the selling suffered over the past three weeks may have jolted the market, the economy, and even society into action. The Fed opened the spigots two weeks ago, and last week the President declared an emergency. Not only does that release funds to combat the coronavirus, it starts the process of bringing the outbreak to a quick close. Thursday’s and Friday’s huge swing reflects the jolt.
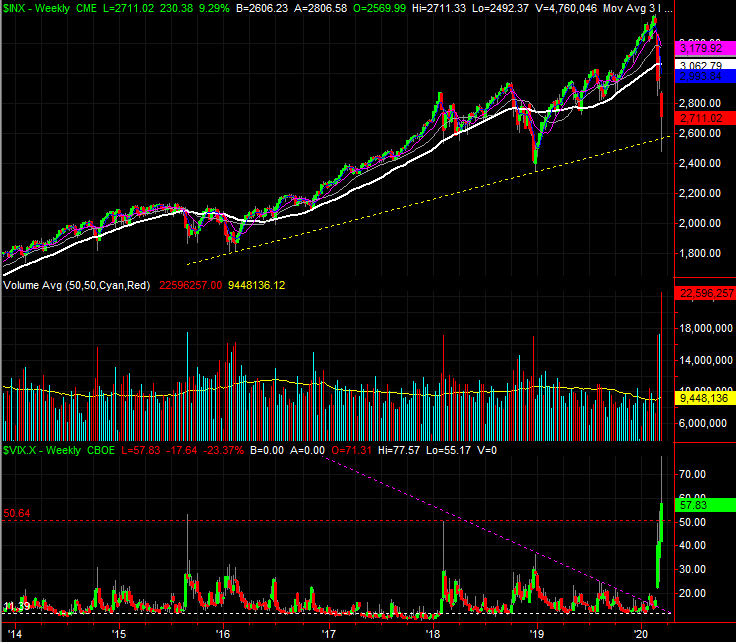
Zooming out to a weekly chart bolsters the argument that last week’s jolt was indeed a capitulation of sorts, for a couple of reasons.
One of them is, the selloff dragged the S&P 500 back down to a technical support line (yellow, dashed) that connects the lows from 2015 and late-2018. Within the confines of that technical channel, the correction thus far may serve as an adequate “reset” of the longer-term rally. The other big clue is, the VIX popped to levels not seen in years, suggesting fear has peaked… peaked as in anybody who wanted to play defense and get out of the market has already done so. There aren’t many/any willing sellers left behind.
S&P 500 Weekly Chart, with VIX and Volume

Source: TradeStation
Underscoring the theory that the last of the prospective sellers have been flushed out is last week’s volume surge. Those volume spikes are also often seen at major pivot points for the market.
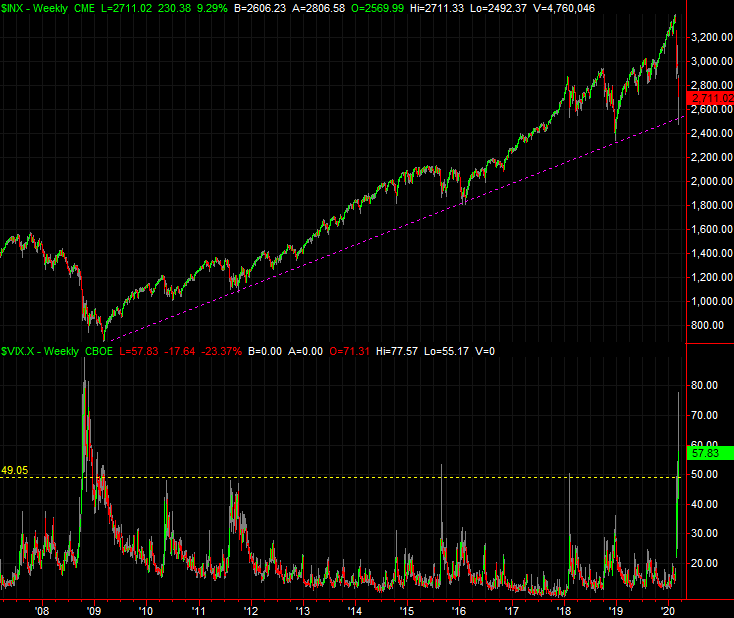
Zooming out to an even longer-term weekly chart helps, and hurts, the bullish argument. It helps to see that — with the exception of 2008’s subprime mortgage meltdown — the VIX has indeed moved about as high as it can before a bottom is made. It’s also noteworthy that last week’s low that touched a major support line touched the support line that’s guided the bull market since its inception back in 2009.
S&P 500 Long-Term Weekly Chart, with VIX

Source: TradeStation
The recent action hurts, however, in the sense that the selloff happened so fast and the backdrop is so scary, investors don’t know what to think. Most bear market’s start slow and are surprisingly gradual meltdowns. Most also start unexpectedly. None of those characteristics apply here, which may well be the reason we shouldn’t count on a recession here. That, and the facts that earnings are still growing and inflation rates are well in check.
This week is going to be an interesting one. Ironically, the one thing we don’t want to see is massive, sweeping bullishness that only leads to another wave of profit-taking. A slower recovery effort that’s kept tempered by a healthy degree of doubt would actually be better for traders counting on the possibility that last week was the capitulation.
The one thing we know for sure is, it’s still all about the coronavirus outbreak. A bunch of analysts fear its effects will linger and cause a recession, meaning stocks have yet to hit their ultimate bottom.


