Weekly Market Outlook – A Familiar Ceiling is Back in Sight
Weekly Market Outlook – September 15th, 2019
Three weeks ago, the market was hanging by a thread. The S&P 500 had just bumped into a well-established technical ceiling that extends back to the early 2018 peak from just a few weeks prior, and was seemingly taking aim at support from the 200-day moving average line.
Then, all it took was a little nudge to put the bulls back into action. They were looking for a reason to see the glass as half full rather than half empty, but it worked. As the weekly chart shows, the S&P 500 is almost backo the technical ceiling plotted as a white dashed line.
S&P 500 Weekly Chart, with VIX, Volume
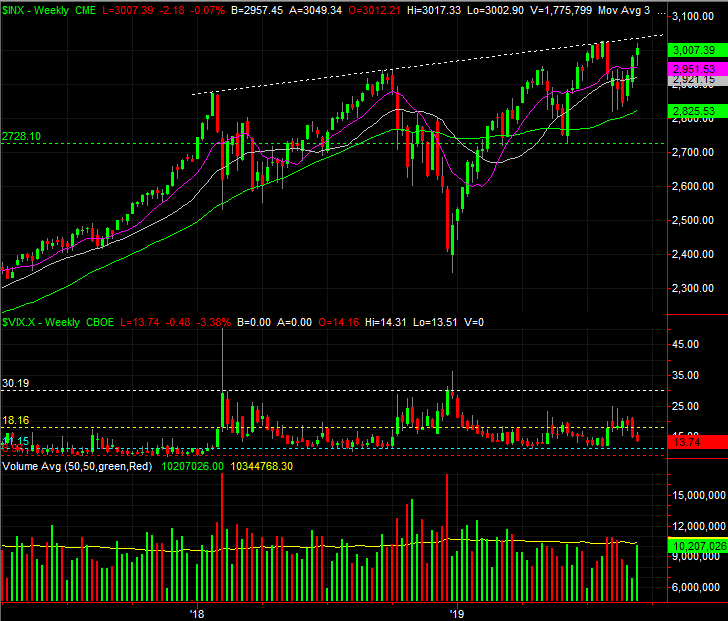
Source: TradeStation
It’s a very flawed effort though, for more reasons than one.
Chief among those flaws is the fact that the VIX is once again back to unusually low levels. It’s not yet back to an absolute low around 11.2, but it’s getting close at the same time the S&P 500 has moved to within 30 points of the upper boundary, currently at 3040. That distance is enough — and enough time — for the VIX to go ahead and fall all the way back to the 11.2 area and then dish out the near-perfect reversal.
Another concern regarding the uptrend is the big gap that was left behind by the big gain from September 5th, highlighted on the daily chart below. Broadly speaking, traders don’t like to leave gaps unfilled. That doesn’t necessarily have to happen straight away though. The index could conceivably move to the 3040 mark first and then slide back to fill in the gap. That move, however, could mean enough bearish momentum is allowed to develop to finally crash below the floors that haven’t broken down yet. That’s most likely to be the 200-day moving average line (green), when all is said and done.
S&P 500 Daily Chart, with VIX, Volume
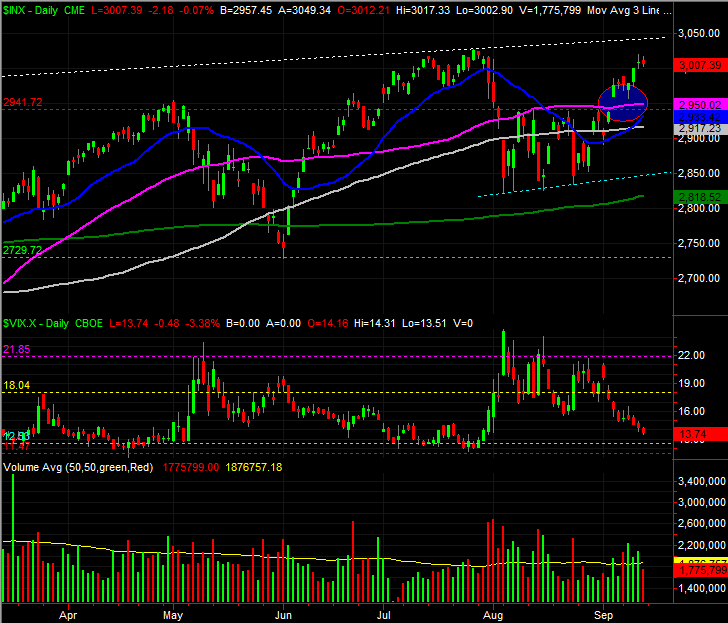
Source: TradeStation
To that end, the TRIN index we pointed out a couple of weeks ago (https://www.bigtrends.com/stocks/a-stock-showdown-is-coming-this-week/) was ‘too high,’ suggesting a bounce was nigh, has almost moved all the way back to the other end of the spectrum to reach ‘too low’ levels that would normally coincide with a market top. But, like the VIX and the S&P 500 itself, it’s not quite to the tipping point yet.
The TRIN data, or Arms Index, in simplest terms is a comparison of the market’s bullish and bearish volume and the market’s advancers and decliners. The ideal reading for the Arms Index is in the middle of its normal trading range, as that allows for trends to be sustained in a so-called Goldilocks scenario … not too hot, and not too cold.
When breadth and depth become mismatched though, that eventually leads to reversals that are largely unexpected. Take a look at how the S&P 500 usually reversed course when the moving average of the daily TRIN data moved to an extreme. The rally that’s taken shape over the past three weeks was accurately signaled by a TRIN reading that moved far too high
S&P 500 Daily Chart, with TRIN (Arms Index) Moving Average
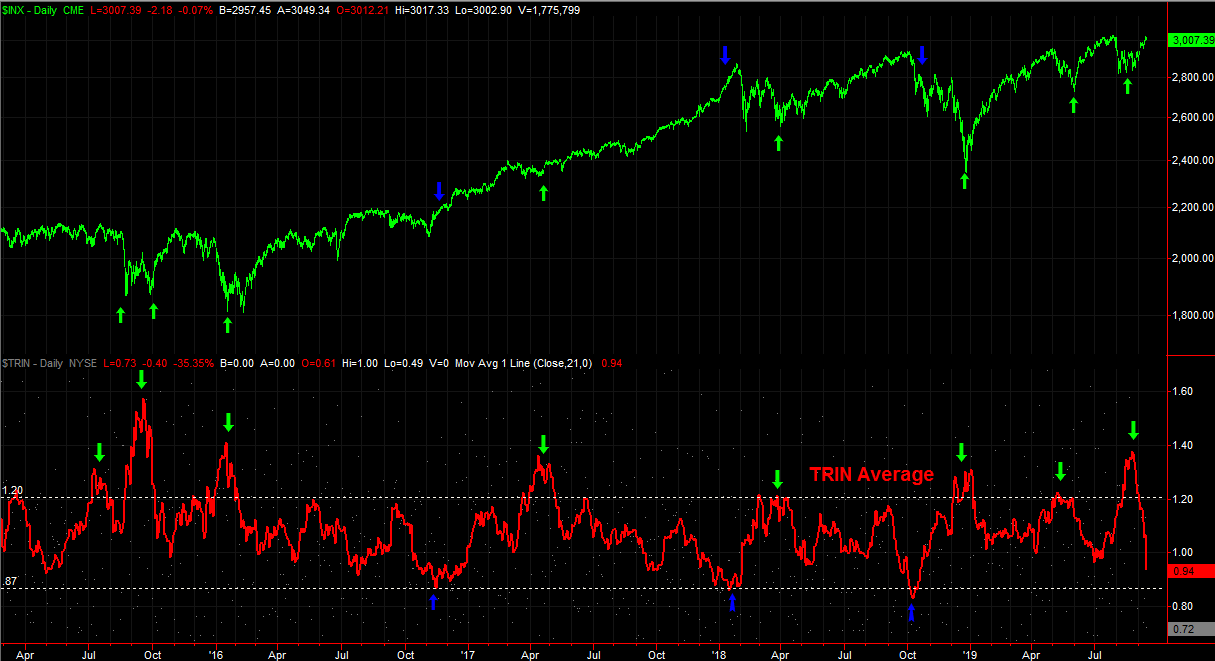
Source: TradeStation
In that light, notice that despite last week’s gains, the NYSE’s bearish volume and decliners appear to be trending higher, while its bullish volume and advancers have been tapered off. This advance isn’t nearly as healthy as the gain itself would suggest.
S&P 500 Daily Chart, with NYSE Breadth and Depth
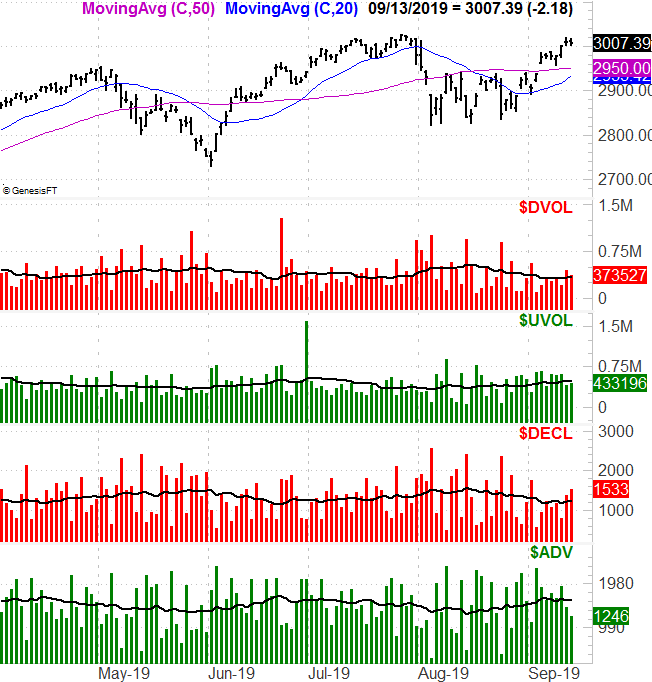
Source: TradeNavigator
That’s not to suggest the breadth and depth tide won’t turn back for the better if and when the S&P 500 manages to break above the resistance at 3040. Anything’s possible. But, such a move would only accelerate the arrival of a correction, and the speed at which it materializes. Pacing will be the key if that move is to last.