Weekly Market Outlook – Record Highs, But Something’s Missing
Weekly Market Outlook – January 12th, 2020
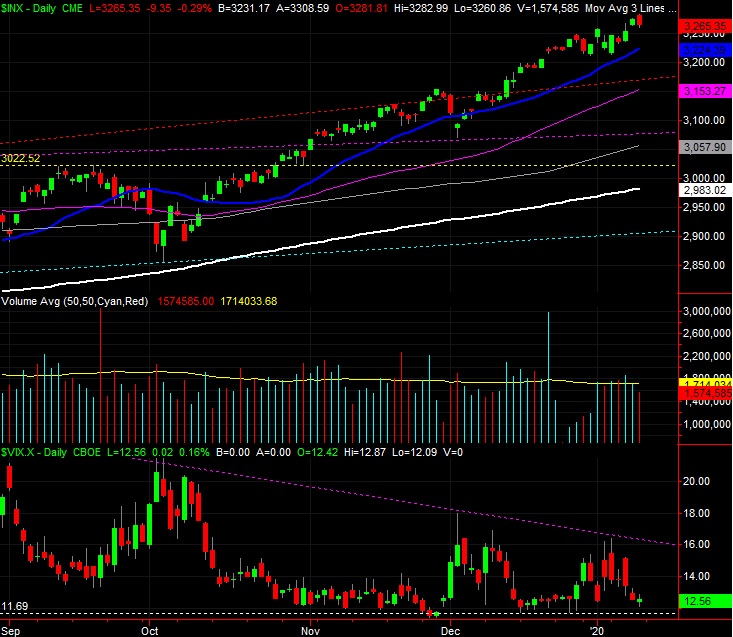
The week was a winner — a big one — right up until it ended. On Friday though, the bulls changed their mind mid-day headed into the weekend. That’s when you most want to see optimism… when investors will be forced to hold stocks for a two-day stretch during which they can’t get out of them. Also notice that even during last week’s three winning days, the volume behind those gains was modest.
S&P 500 Daily Chart, with VIX and Volume

Source: TradeStation
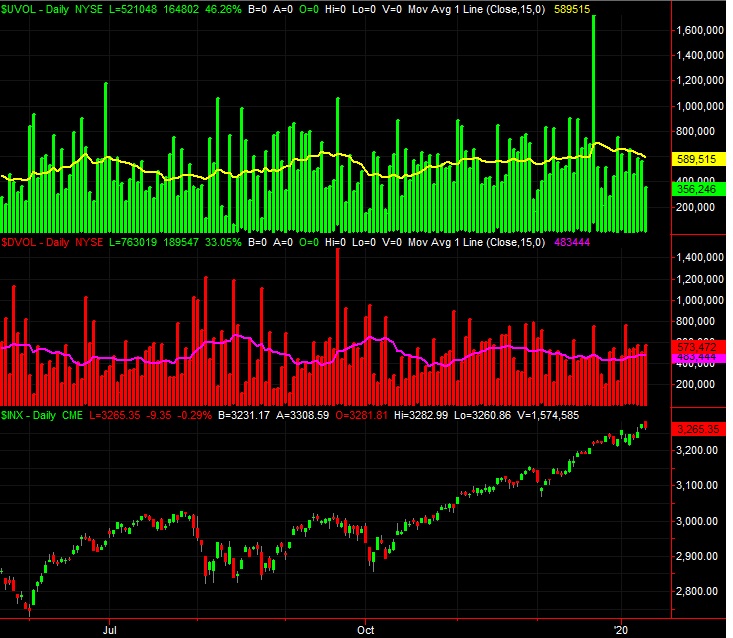
And don’t dismiss the volume trend. Not only was there a lack of volume with last week’s “up” days, the daily level of bullish volume (UVOL) has been shrinking since the end of last year. Meanwhile, the amount of daily bearish (DVOL) volume has been growing.
S&P 500 Daily Chart, with NYSE Up, Down Volume

Source: TradeStation
That can’t come as a total surprise, for a couple of different reasons.
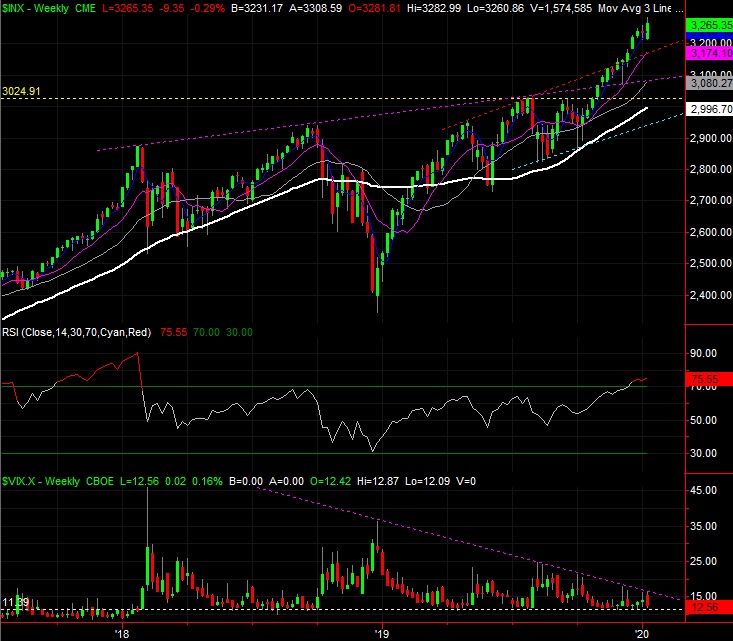
One of those reasons is, the S&P 500 has now rallied nearly 14% from its early October lows. That leaves it overextended in the near term regardless of the context behind it. (It’s even more overbought given how far it rallied during the first three quarters of last year. The weekly chart of the S&P 500 has pushed its RSI indicator into overbought territory for a couple of weeks now, and more so than it had since the very beginning of 2018.
S&P 500 Weekly Chart, with VIX and RSI

Source: TradeStation
The other reason is, the VIX is not only back at uncomfortably low levels, but appears to be now trapped in the tip of a converged wedge pattern that will force the bulls and/or the bears to make a commitment. With stocks — by some measures — more overvalued than they’ve ever been, the bear case is bolstered. That’s not necessarily a call for a bear market, but a setup for a sizeable correction.
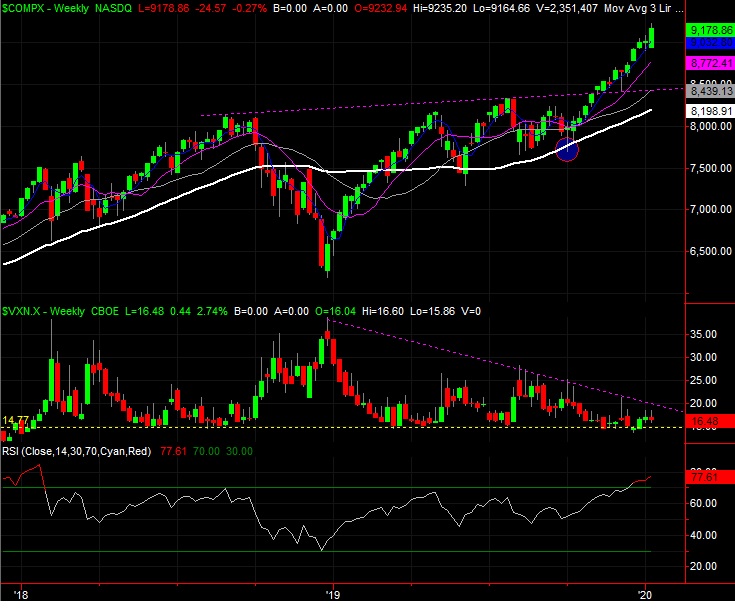
The same basic story for the NASDAQ… that is, the momentum seems healthy, but the persistence of the momentum since early October has left the index overbought and overextended. Also notice that the span of the advance since early October is more or less about the same pace and distance as the rally that started to take shape beginning in late 2018. That move wasn’t the bull market’s last hurrah, but it did set up a reasonably painful pullback. And, like the S&P 500’s VIX, the NASDAQ Composite’s Volatility Index, the VXN, has also been pushed into the tip of a converging wedge pattern. The upper boundary is marked as a purple, dashed line. Breaking above that level could also mark the beginning of an overdue correction.
NASDAQ Composite Weekly Chart, with VXN and RSI

Source: TradeStation
Still, the momentum is bullish. It would take a move below the 20-day moving average lines (marked in blue) to even start entertaining the prospect that the correction is finally upon us.


