Weekly Market Outlook – Stocks Can’t Ride the Fence Forever
Weekly Market Outlook – October 20th, 2019
Just a few weeks ago the threat of a major turning point for the market was upon us. We were hoping the lack of room to simply drift sideways within the confines of a narrowing trading range would force stocks to bolt higher or lower. But, no dice. The S&P 500 and other key indices are still on the fence, with even less room to maneuver now. That’s annoying, but ultimately good news as it brings us even closer to the point where the market will have to do something decisive.
What that may be remains entirely in question. The bulls have the advantage of being above all the key moving average lines, most of which are also pointed upward at this time. The bad news is, we’re at a time of year (and a time within the four-year presidential term cycle) that’s generally not good for stocks.
Relief should start in mid-November, but ironically, the one thing working against that relief is a lack of clear weakness right now. We’d be best served by selling off rather roughly right now and making a good, clear bottom rather than continuing to drift sideways and ease into that bullishness. The market is pretty frothy as is.
There is good news, no matter what’s in store — the lines in the sand have become crystal clear. For the S&P 500 that’s (still) the support line that connects the low from early this month with the key lows from August. That’s plotted in light blue on the daily chart below, and it aligns with the 200-day moving average line (white). At the other end of the spectrum, the technical ceiling around 3022 (yellow, dashed) is still intact as resistance.
S&P 500 Daily Chart
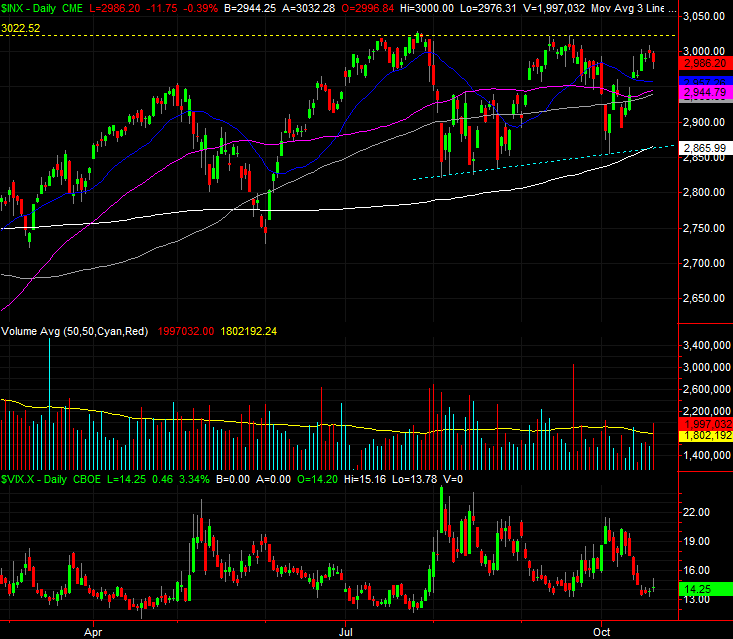
Source: TradeStation
As is usually the case, zooming out to the weekly chart puts things in perspective. In this instance doing so really illustrates just how stagnant the market has been of late. In the past it’s either made prolonged rallies or pullbacks, with only short-lived gyration. Things have gone nowhere (constructive) since May though, and there’s still a little room left between the key support and resistance levels to continue doing nothing.
S&P 500 Weekly Chart
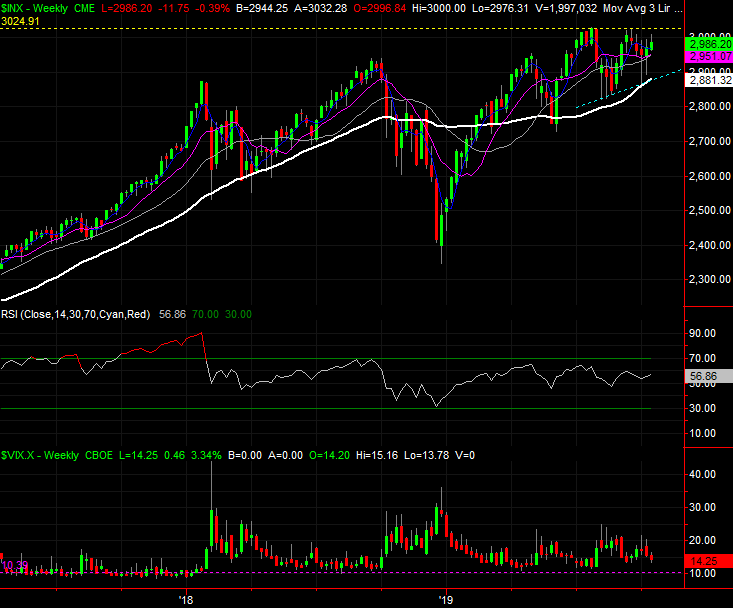
Source: TradeStation
The daily chart of the NASDAQ Composite more or less tells the same story, but with a couple of different nuances.
One of them is, it’s already made a couple of lower highs (purple, dashed). Another is its best support line is horizontal rather than pointed upward, parked near 7697 where the index has hit lows several times since August. And, perhaps most obscured of all is that the NASDAQ’s volume tide has already turned bearish — almost — as evidenced by its accumulation-distribution line.
NASDAQ Composite Daily Chart

Source: TradeStation
Should that A-D line break below 44.02 million and the NASDAQ itself fall under 7697, that’s trouble… and more than a little. The composite tends to lead the rest of the market, higher and lower.
The question is, how far might a breakdown drag the broad market? A painful but palatable pullback is actually a somewhat desirable outcome here to set up a year-end rally. A bullish move could trigger more bullishness by virtue of blasting past resistance, but there’s little room left for gains beyond that point given how little certainty there is about the condition of the economy. And, there’s no trade-based catalyst on the near-term horizon.
That puts all the focus on earnings season, but that will take through the end of November to draw any clear conclusions. That makes it tough to expect anything besides more range-bound action ahead.