Weekly Market Outlook – Too Good for Our Own Good
Weekly Market Outlook – November 3rd, 2019
It’s almost too good to be true… which is the problem. Both the indices blasted past horizontal ceilings, and in the case of the S&P 500, it also pushed past a rising technical resistance line that extends all the way back to the early 2018 peak (plotted as a purple dashed line). The volume behind the advance was progressively bullish too. This is, by definition, a breakout.
S&P 500 Daily Chart, with VIX and Volume
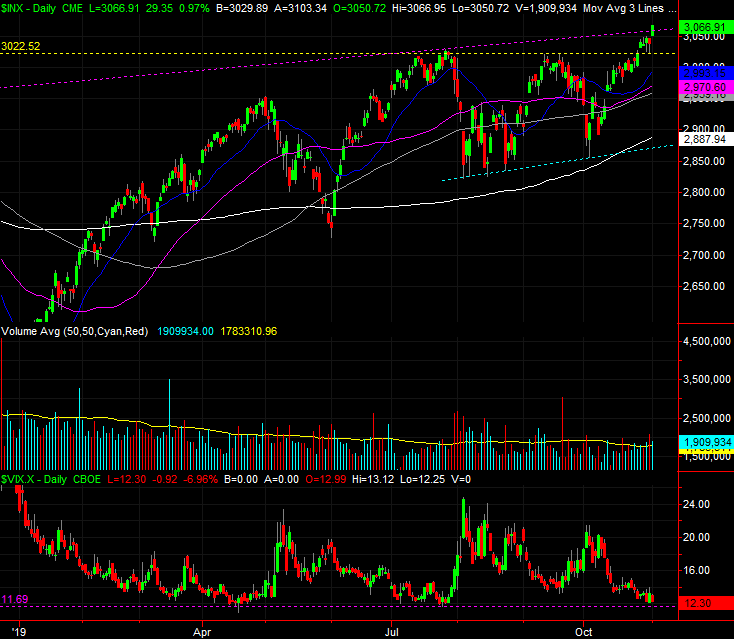
Source: TradeStation
The breakout thrust is materializing at a distinct disadvantage though. That is, the index is up 30% from December’s low, and is up 7% in just the past five weeks. It’s not technically overbought as measured by the weekly chart’s RSI line, but it’s as close to being overbought as it was in May and July… right before a couple of noteworthy selloffs.
S&P 500 Weekly Chart, with VIX
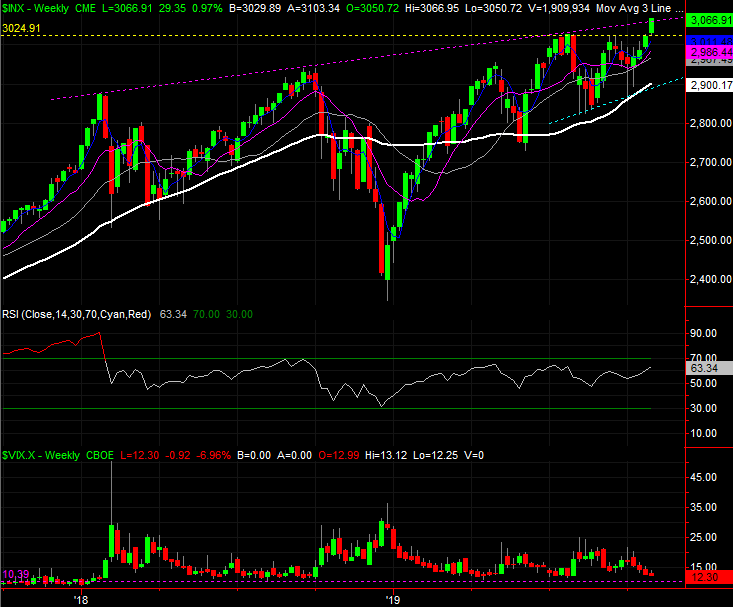
Source: TradeStation
Also notice on the weekly chart that the resistance line (purple, dashed) that capped the index in January of 2018 September of last year and July of last year wasn’t able to do the job again last week. [The weekly chart of the S&P 500 also shows how close the VIX is to an absolute low.]
The same can’t be said of the NASDAQ Composite’s weekly chart. It tested its overarching technical ceiling, but didn’t push above it. The momentum here looks solid, but it looked solid in June/July and all throughout the first quarter as well. Both instances ended in a pullback.
NASDAQ Weekly Chart, with VXN and Volume
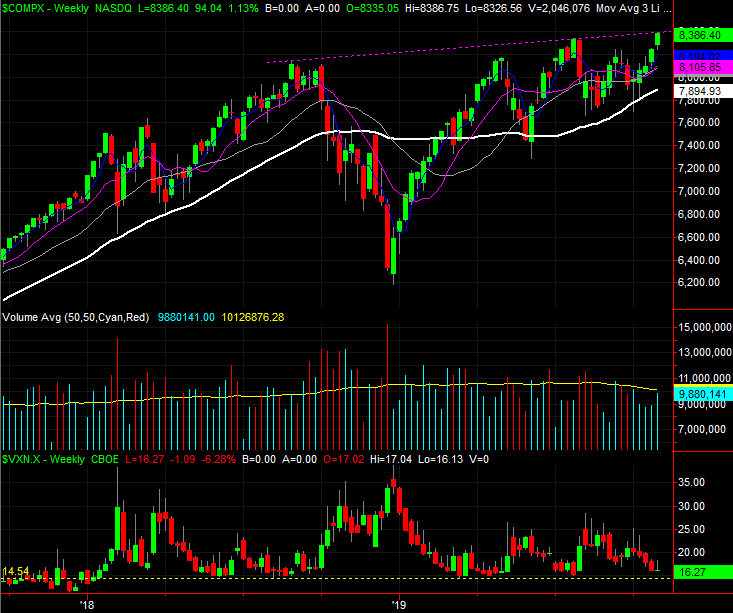
Source: TradeStation
A zoom-in of the daily chart, for perspective…
NASDAQ Daily Chart, with VXN and Volume
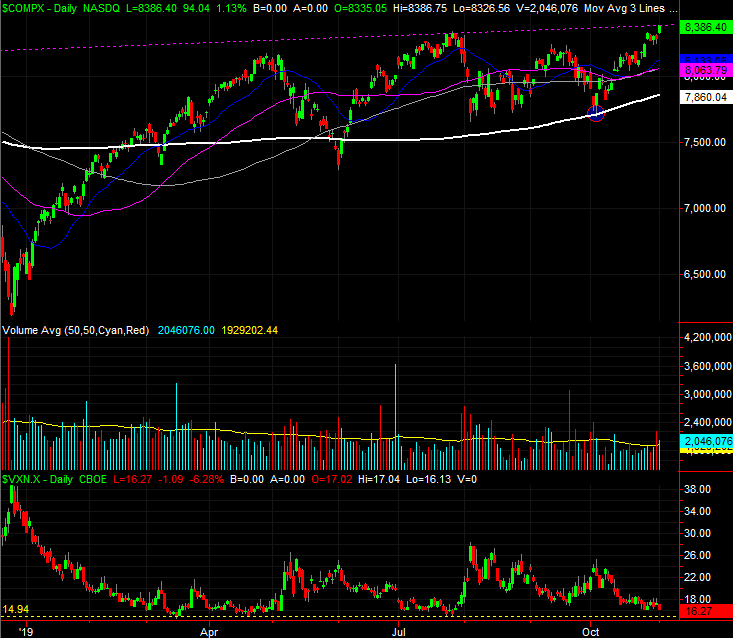
Source: TradeStation
This recent strength has thoroughly up-ended the market’s usual calendar-based day-by-day progress. The market should have been tepid through October moving into the typical November/December bullishness. In fact, the market should have moved sideways since May. It’s up since May, and even up since August when it should be down. In fact, it’s uncomfortably ahead of its usual pace.
S&P 500 Year-to-Date Return vs. Average
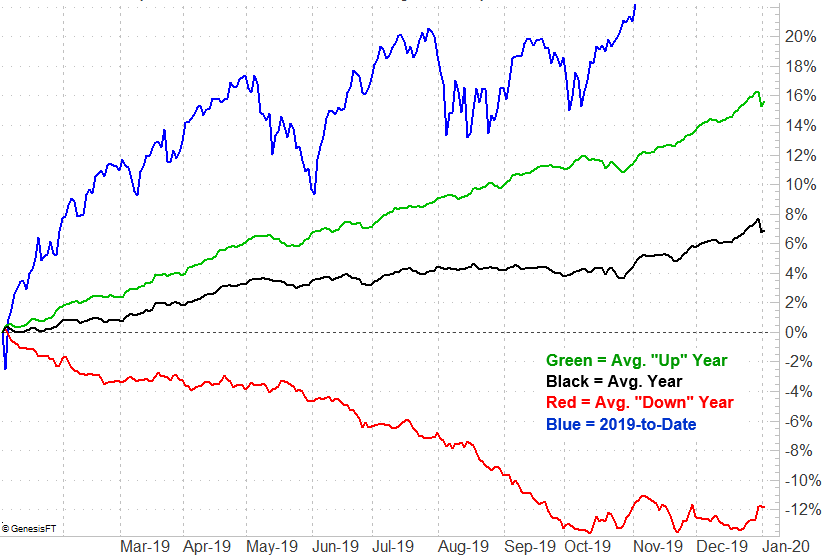
Source: TradeNavigator
That’s even more the case if you’re a believer that the presidential term cycle and the subsequent midterm election cycle can make a difference. Stocks should be weak through the latter part of this month (in good years or bad), but the S&P 500 has been unusually bullish of late.
S&P 500 Presidential-Term Return vs. Average
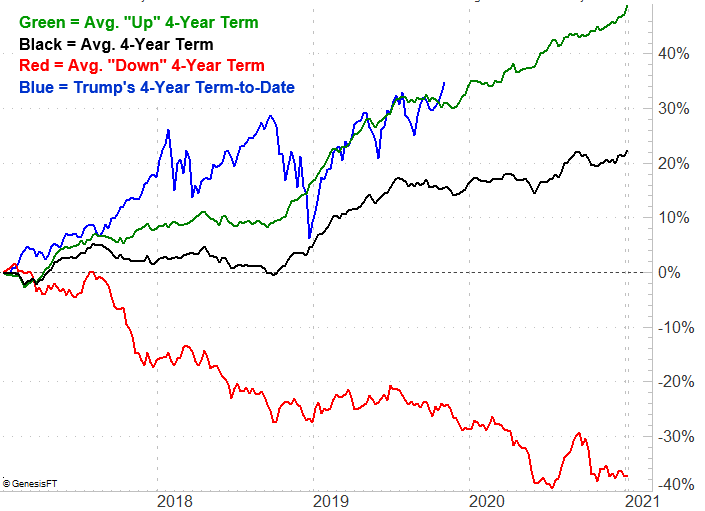
Source: TradeNavigator
That’s not to say the market has to follow its usual course this year. But, if it doesn’t, it’s a huge bucking of the usual trend. In fact, the S&P 500 has already defied the odds, so to speak. Traders are just that excited.
Two things that could quell that excitement in a hurry, of course, is a setback on the trade war/tariff front, and disappointing earnings reports from the wrong companies.