Weekly Market Outlook – The Rally is Vulnerable to This Week’s News
Weekly Market Outlook – November 10th, 2019
Were circumstances different, the past five weeks would be the foundation for a much bigger breakout. But, circumstances aren’t different. The five-week, 6% gain means the S&P 500 is now up 32% since the December low. And, while that December low started with the advantage of taking shape after a pretty severe October-December drubbing, it’s still an unusually big runup given the timeframe. It’s also worth noting that earnings have actually stagnated of late. The gains are being made on an assumption that earnings growth will be rekindled. That’s a pretty bold bet. The yellow arrow on the chart is where Q3’s earnings stand, with nearly 90% of reports now in-hand.
S&P 500 Monthly Chart With Earnings, Past and Projected
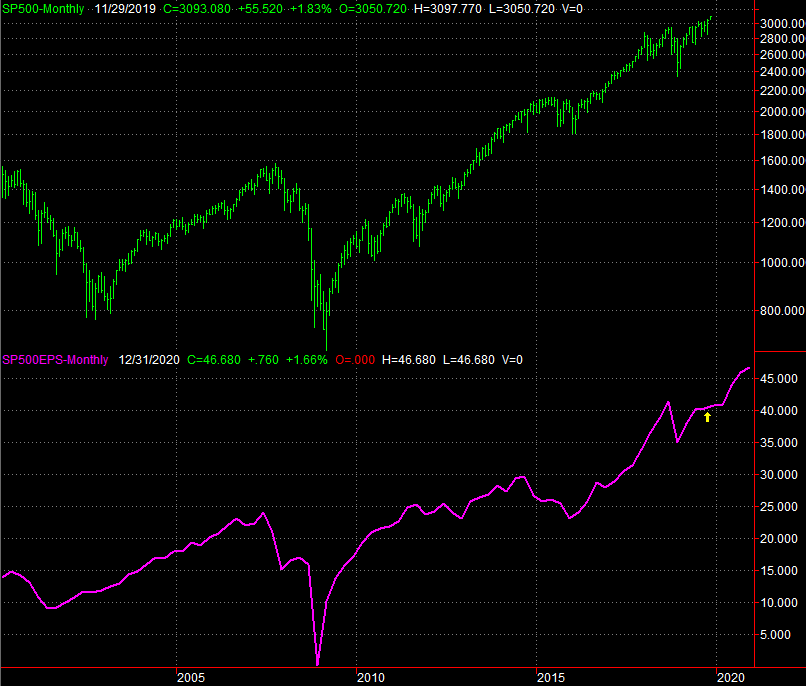
Source: TradeStation
Either way, the weekly chart of the S&P 500 is now almost overbought (RSI). Also notice the weekly VIX is now bumping into a rather well established technical floor, plotted in yellow.
S&P 500 Weekly Chart, with VIX
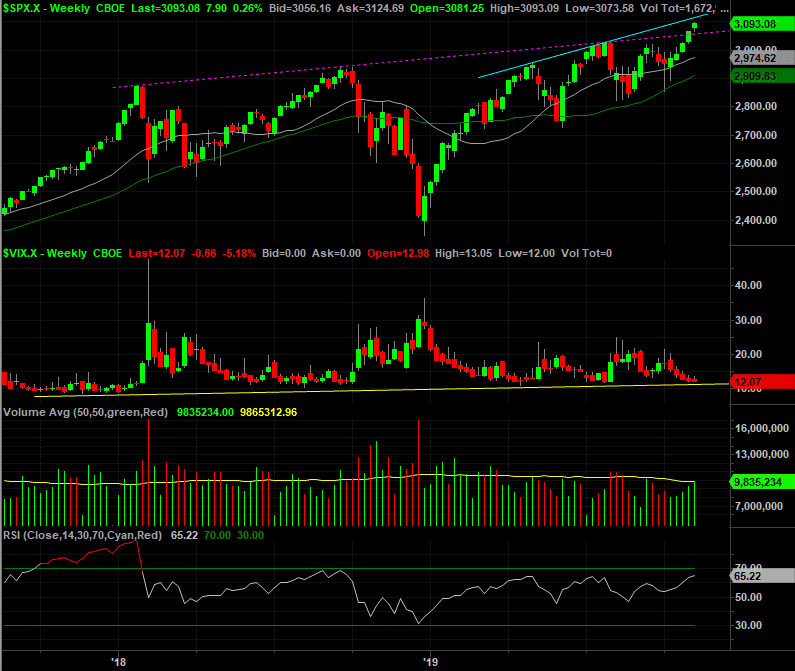
Source: TradeStation
Still, one has to appreciate the fact that the volume has been rising all the way up since early October. There’s also a little more room for the index to keep rising before bumping into the ceiling that aligns the April and July peaks. All the same, there’s not a whole lot more room for the market to keep on truckin’.
The same key nuances apply to the weekly chart of the NASDAQ Composite, save one key exception – the NASDAQ is already bumping into the technical ceiling that aligns the April and July highs.
NASDAQ Weekly Chart, with VXN and Volume
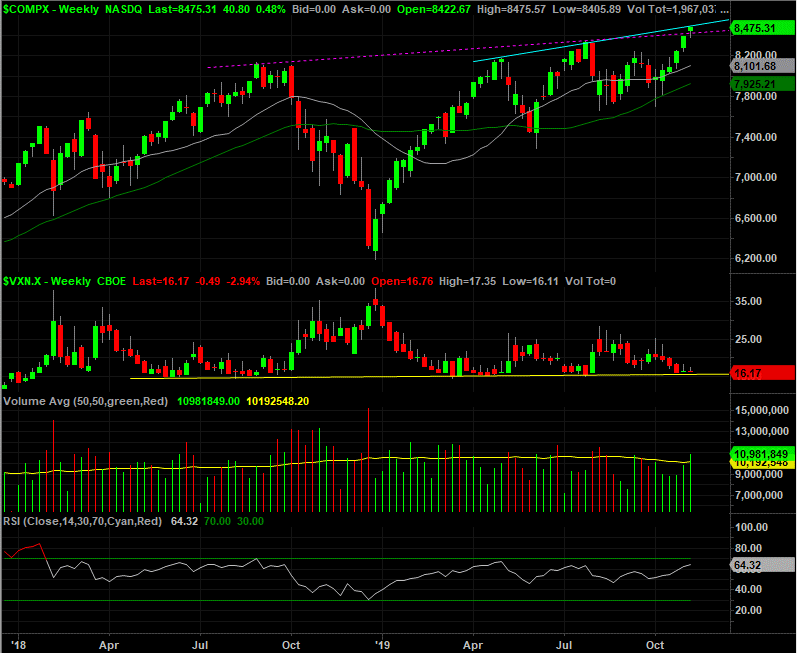
Source: TradeStation
Zooming into the daily charts doesn’t change anything. But, it does show us where things are apt to stop and turn… in the event of a correction. For the S&P 500, there are two big lines in the sand. The first one is the same floor that prompted the lows in August and October, marked as a white dashed line. The other is the VIX’s technical ceiling… ceilings, actually. One of them is the horizontal resistance at 23.85 plotted in purple. The other is the falling ceiling, marked as a gray dashed line, that tags most of the peaks since October of last year. Both are around 23.85 right now though.
S&P 500 Daily Chart, with VIX and Volume
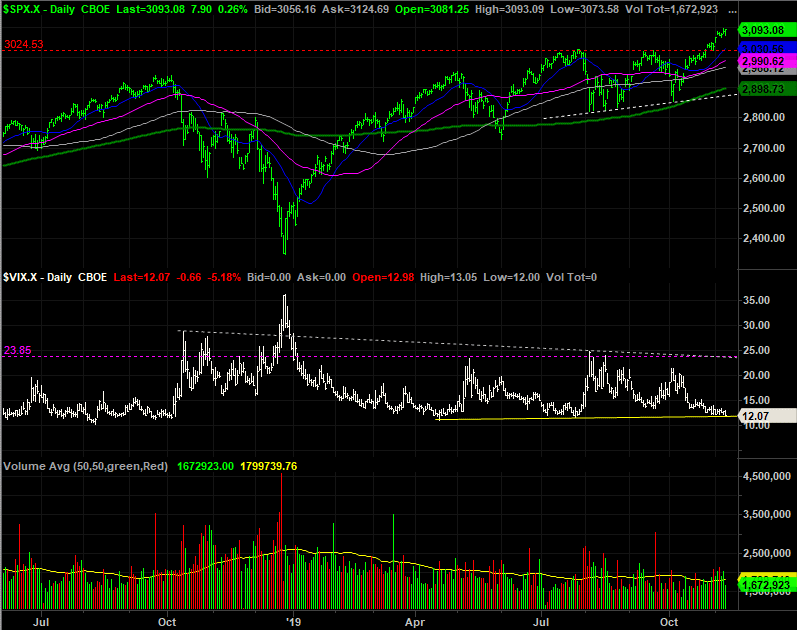
Source: TradeStation
For the NASDAQ, there are two potential landing points. One of them is the 200-day moving average line plotted in green, currently at 7893.8. The other is the line that connects most of the lows since late March, plotted as a white dashed line. It’s currently at 7730, and rising a bit.
NASDAQ Daily Chart, with VXN and Volume
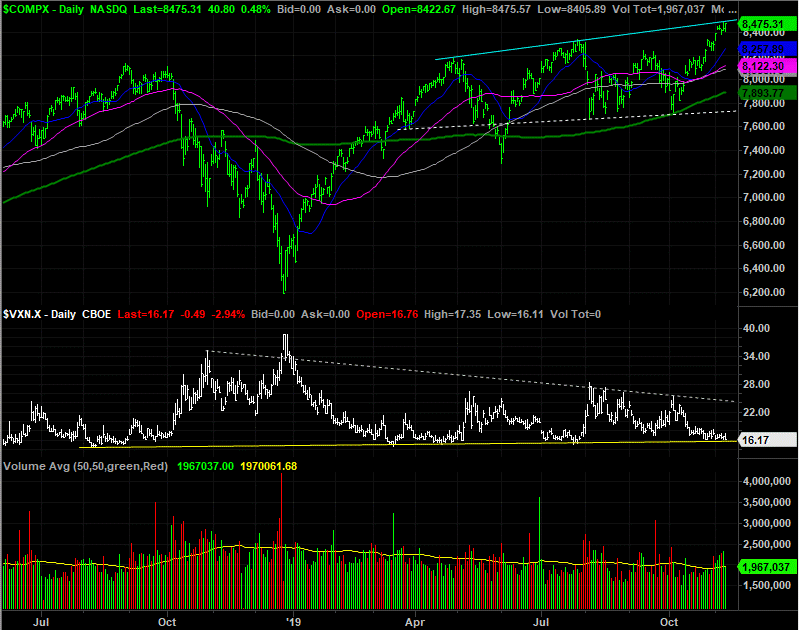
Source: TradeStation
Of course, in the current environment, a technical read on the market doesn’t mean a whole lot. It’s all sentiment right now, and one headline or political development could change that sentiment at the drop of a hat. Exacerbating the headache here is the fact that we’re now in a usually-bullish time of year. This time though, we’re starting out with the disadvantage of being at the tail end of an oddly bullish ten-month stretch.
That being said, we can’t rule out a meltup here either. It would only take a small break above the ceilings now being tested to incite that kind of enthusiasm again. Traders seem to want to make the usual year-end rally happen, even if it’s not the healthy thing to do right now.