Weekly Market Outlook – Nothing Is As It Should Be
Weekly Market Outlook – November 24th, 2019
It can’t be that surprising. A technical ceiling that connected the April and July peaks was bumped into a couple of weeks back, but the S&P 500 was unable to push past that line (red, dashed) in the sand two weeks ago. Last week was no different. That line is clearly going to be a problem, though the sheer scope of the 9.5% gain from the early October low doesn’t help the bullish case.
S&P 500 Daily Chart, with VIX and Volume
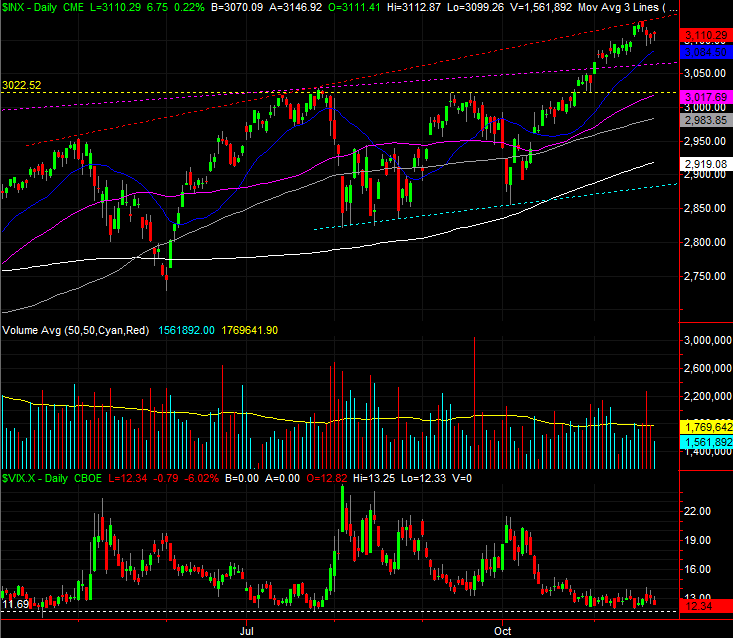
Source: TradeStation
Nevertheless, it’s noteworthy that even with last week’s loss, the S&P 500 still held up reasonably well as the week wound down. Friday’s gain was underscored by a second day of higher lows and a higher high. Also notice the index didn’t fall under any of its key moving average lines.
The same basis analysis applies to the NASDAQ Composite. It briefly broker above its key technical ceiling on Monday, but by and large, that’s clearly a technical — and now psychological — line in the sand. Also notice that while both indices gained ground on Friday, they did so on very little volume. Conversely, the big losses from Wednesday and Thursday were both on higher volume.
NASDAQ Daily Chart, with VXN and Volume
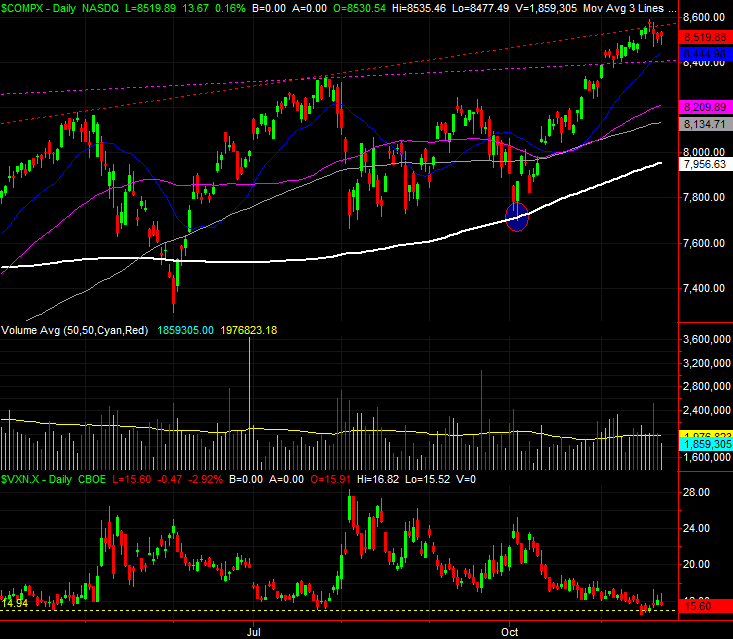
Source: TradeStation
Here’s why it’s a problem… of sorts.
The S&P 500 is way too far ahead for where it should be thus far this year. On average it would be up 4.9% at this point, just starting to rebound from an October lull. We never got the October lull though. In fact, we haven’t seen a real lull this year at all.
S&P 500 Year-to-Date Performance
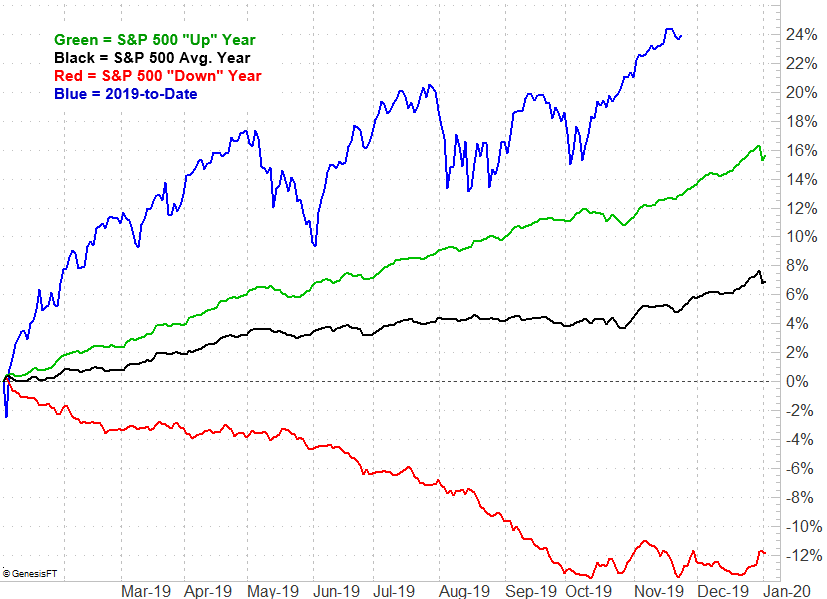
Source: TradeNavigator
Yes, last year’s meltdown has exaggerated this year’s rebound. Still, the market is “well ahead of schedule.” Even removing losing years, the S&P 500 should only be up 12.7% year-to-date. It’s actually up 24.1%.
The performance chart, however, also shows that November and December are reliably bullish months. Even in bearish years, the last quarter of the year is merely choppy, without being bearish.
Even wiping away the impact of 2018’s unusual selloff though, and looking at how the S&P 500 fares over the course of the usual four-year Presidential term, the market is overbought. It should be up 14.1% since the end of 2016, or no more than 30.2% for a bullish four-year term. It’s up 36.8%, never suffering the usual July-November weakness we’d normally see in the third year.
S&P 500 4-Year Presidential Term Performance
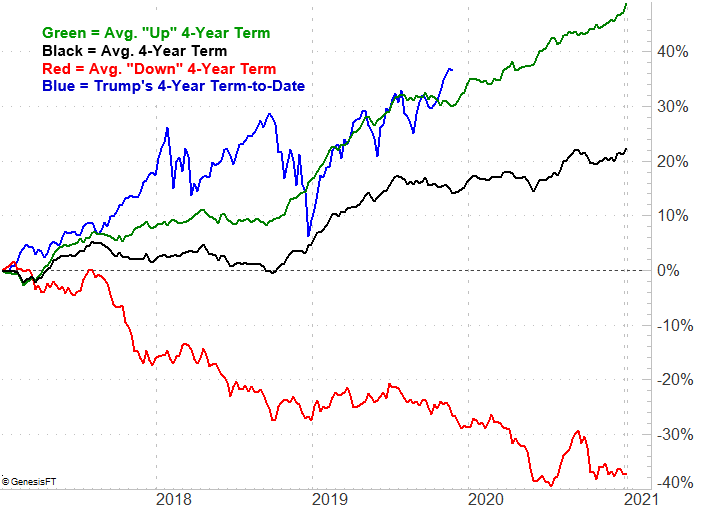
Source: TradeNavigator
The good news is, the fourth year is usually a pretty good one, presuming we’re not in a full-blown bear market. The bad news is, it still feels like we’re going to have to pass through a full-blown stumble to clear the path for such a move. (We’re also going to need reason for optimism regarding the tariff war.)
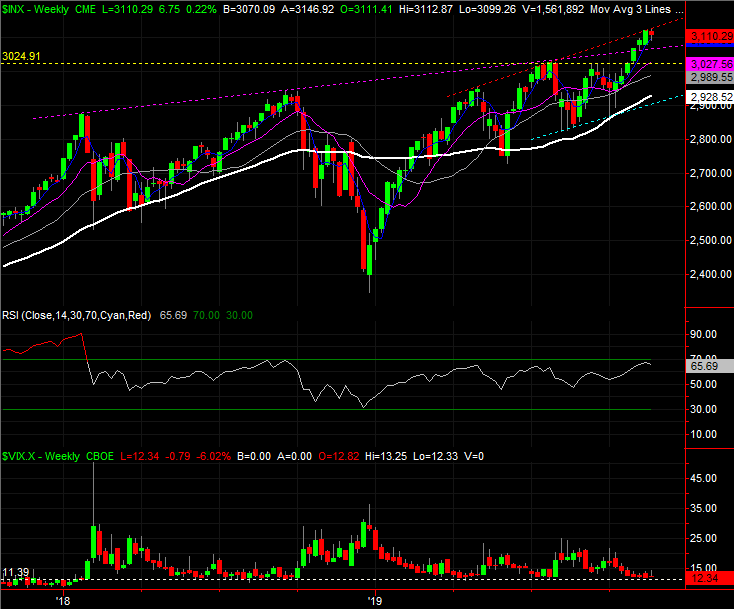
Zooming out to a weekly chart of the S&P 500 or the NASDAQ suggests the same thing. Stocks are already technically overbought, with the S&P 500’s RSI line just coming off of a multi-month reading that was only matched by the peak from September of 2018, right before a meltdown. You can also see on the weekly chart that the VIX is unable to move below its more absolute floor around 12.0 Never even mind the fact that it’s struggling after bumping into the upper boundary of a trading range.
S&P 500 Weekly Chart, with VIX
Source: TradeStation
The market should be peeling back here, but it seems pretty intent on delivering a Santa Claus rally. Only a shift in sentiment, sparked by unexpected headlines, will do the trick. Not even mediocre fundamentals appear to nag at investors right now. The first red flag of trouble right here would be the S&P 500 falling below its 20-day moving average line at 3084.5, and even then, it might be smart to see if it rebounds.