Weekly Market Outlook – Not the Right Way, But the Right Result
Weekly Market Outlook – April 19th, 2020
The good news is, both of the key indices we watch managed to punch through some major resistance levels, and did so on some respectable volume. The bad news is, the gaps we were lamenting a week ago not only remain unfilled, we left another one behind thanks to Friday’s opening surge. Stocks may have to slide all the way back to somewhere around the March 23rd low to fill them all in.
And yet, that might not necessarily be a bad thing.
Before diving into the charts, a little philosophy: Traders are working hard trying to outguess the impact of the coronavirus. They’re right to think it will eventually become a faded memory. They may be getting a little ahead of themselves though. Q1’s earnings are going to be awful, and while “the crowd” says they understand it, when they actually start seeing those rough numbers in print, they may not be able or willing to stick with the stocks they bought until there are healthier results to tout. That sets the stage for a pullback that will cool the market until the latter part of Q2, when we’ll finally start to see things with a little more clarity.
Or, maybe there are enough willing bulls and buyers to plow right through that uncertainty and disappointment. That’s certainly what the charts are saying is starting to happen anyway.
Take the daily chart of the S&P 500 below for example. That pink line is the 50-day moving average line, and although just barely, the index made away above it by the end of last week. Also notice the strong volume behind the gain. For that matter, also take note of the fact that the VIX continues to inch lower rather than plunging. That suggests traders are seeing things in a healthy, measured, and cautious way rather than assuming everything is going to be fantastically fine in the foreseeable future.
S&P 500 Daily Chart, with VIX and Volume
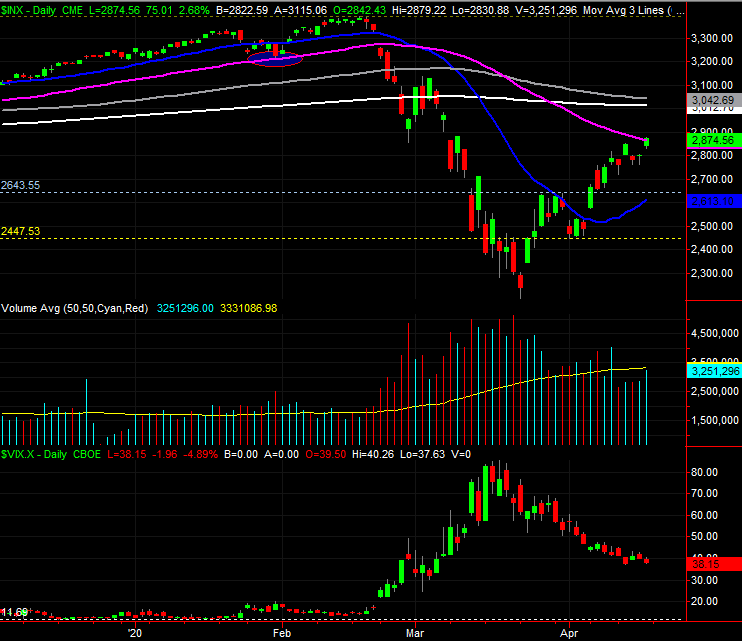
Source: TradeStation
The same basic analysis applies to the NASDAQ Composite, although the NASDAQ is even a little more encouraging. Led by FANG stocks, the composite cleared its 50-day line and its 200-day moving average line (white) earlier in the week, and was testing its 100-day moving average line (gray) as of the end of the session on Friday. You’ll also see there’s a heck of a lot more buying volume for NASDAQ stocks than there was for the S&P 500, which broadly speaking is a subtle bullish clue.
NASDAQ Composite Daily Chart, with VXN
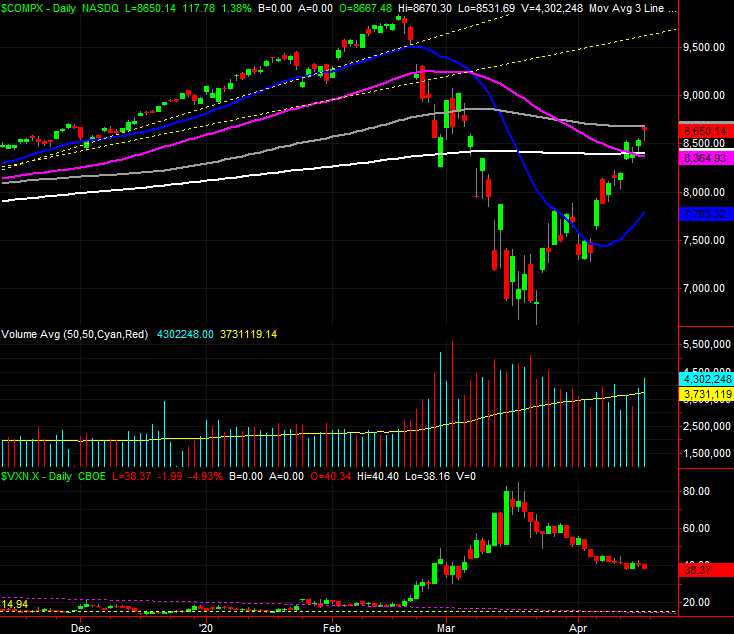
Source: TradeStation
We’ll zoom out to a weekly view of the S&P 500 just for a little more perspective, though bear in mind that sentiment rather than momentum or history is running the show now. So, take this look with a grain of salt. Nevertheless, notice that’s a key Fibonacci retracement line coming up at 2935.5 (a 5/8 or 61.8% retracement of the entire March pullback). Also notice there’s a prospective technical ceiling plotted with a yellow dashed line currently around 3100, which connects the major market peaks since early 2018 except for the big runup that began late last year.
S&P 500 Weekly Chart, with VIX and Volume
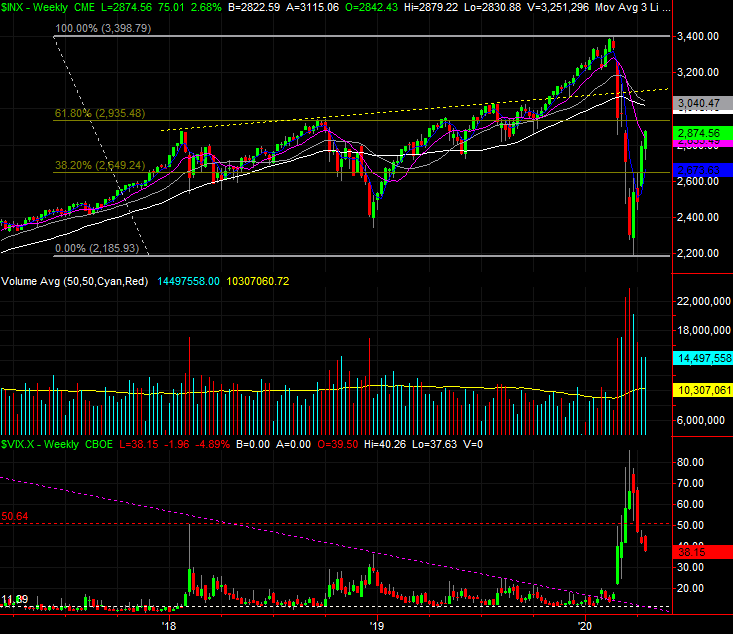
Source: TradeStation
In some ways testing either prospective technical ceiling now rather than later is less desirable, simply because that would up the odds of a nasty pullback. It would be better to actually take a few lumps now and then let traders regroup in a few weeks and try again… a rally founded on actual, verified earnings growth. If the S&P 500 moves all the way up to the 3100-ish area, the pullback will hurt more, and may make traders less likely to try again at a more reasonable time.
Still, this all remains a day-to-day matter.