Weekly Market Outlook – If the Market’s Going Down, It’s Going Down Fighting
The bears growled last week, but it’s not like the bulls willingly, sheepishly rolled over. They at least pushed back, and when push came to shove on Friday, it was the bulls doing the shoving.
Granted, the bulls had some help from a key support line, and it’s not like Friday’s gain was a high volume affair. It’s something for them to build on this week though.
The market lost 2.1% of its value last week, even with Thursday’s and Friday’s rebound from deep intraday lows. When all was said and done, the 50-day moving average line (purple) did its job as a support level. The VIX also broke back below an important technical ceiling around 18.0 after breaking above it early in the week. The tide is bullish, like it or not.
S&P 500 Daily Chart, with Volume
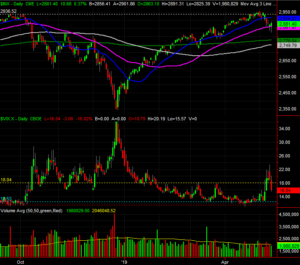
Source: TradeStation
You don’t have to like it well enough to plow back into long, bullish positions though.
Breakdowns, like breakouts, are often more of a process and less of an event. There’s little doubt the market was overbought headed into the beginning of this month. Just because it didn’t crack last week doesn’t mean it still can’t, or won’t.
Whatever’s in the cards, it’s likely to happen this week. And, we know where the lines in the sand are. They’re the same ones we were eying a week ago. The VIX needs to be above 18.0 and the S&P 500 needs to be below its 50-day moving average line (currently at 2860) to assume the worst. At the other end of the spectrum, the S&P 500 will have to push past its 20-day moving average line (blue) at 2914 and then its recent peaks near 2953 to justify adding new bullish positions. We’re not at the right not of year nor in the right circumstances to reasonably expect that to happen.
The same basic interpretation of the NASDAQ Composite’s chart applies. The VXN is back under its pivotal level near 21.3, and the ultimate ceiling for the composite is last week’s high around 8167.
NASDAQ Composite Daily Chart, with Volume
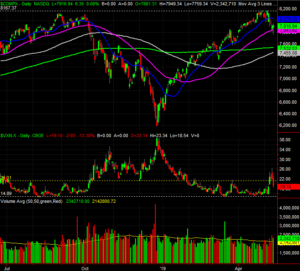
Source: TradeStation
And the calendar really is a problem.
While the whole ‘sell in May and go away’ theory is overdone, it’s not without its basis. This month, on average, yields a 0.2% gain, and falls about 40% of the time… not exactly the greatest track record, or odds.
The calendar isn’t the only problem the market is quietly facing right now, however. As much as stocks tried to stage a recovery on Thursday and successfully did so on Friday, the bullish volume backing those gains hasn’t exactly been convincing.
The graphic below is one we’ve seen before, but one that become remarkably interesting again last week not because of what’s being seen, but not seen. Despite a couple of bullish pushbacks late in the week, the up volume trends remains tepid, and the down volume trend is still robust. Friday’s gain wasn’t exactly a convincing blow to the bearish undertow.
S&P 500 with NYSE Up, Down Volume Chart
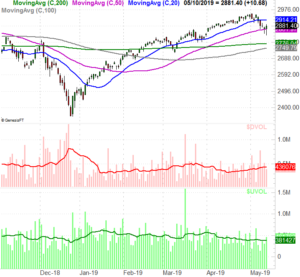
Source: TradeNavigator
Still, stocks remain mostly on the fence.
As much as the market may deserve a wave of profit-taking, even if the indices break down here (and there’s no assurance even that will happen), the 200-day moving average line (green) and the 100-day moving average line are still immediately below, ready to become support. For the S&P 500, they’re at 2776 and 2751, respectively. It would be surprising if the bullish-intended market didn’t make a floor out of those levels, at least upon any initial contact.
The technical ceilings were already mentioned above.
The challenge here is waiting, and preparing for the distinct possibility that the market may be content to go nowhere for a while, and rather just waffle between support and resistance until there’s a clear catalyst to knock stocks out of their rut.
– Price