Weekly Market Outlook – A Good Rally Effort Spoiled
It was a nice little headfake from the bears on Thursday. Stocks rekindled a break above a major technical resistance line, but only to make Friday’s tumble all the more painful.
And yet, as rough as Friday’s 1.9% setback was, it’s still not pulled the market below even the first of its key technical floors. The S&P 500 remains above its 20-day moving average line, as well as above all of its other key moving average lines.
Nevertheless, there are still some key concerns here that suggest the market is going to have to fight to hold its ground. Chief among them is the amount of volume that materialized with Friday’s setback. It wasn’t huge, but it was above average, and above Thursday’s bullish volume. There were more sellers than buyers last week.
S&P 500 Daily Chart, with Volume
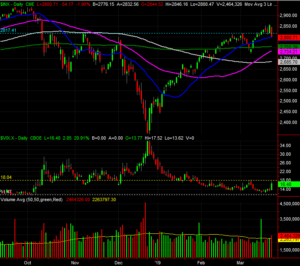
Source: TradeStation
The other big red flag? The VIX. It popped in a pretty big way on Friday. It didn’t make its way above a key technical ceiling around 18. But, it’s testing that line in the sand at the same time the S&P 500 is testing support at its 20-day moving average line. If both push through, that could signal at least a little profit-taking pressure.
The daily chart of the NASDAQ Composite more or less tells the same story. The only exception is, of course, the VXN. Its line in the sand is the ceiling around 22. If it fails to keep the VXN in check, that will likely coincide with a more serious – though not devastating – pullback from the NASDAQ.
NASDAQ Composite Daily Chart, with Volume
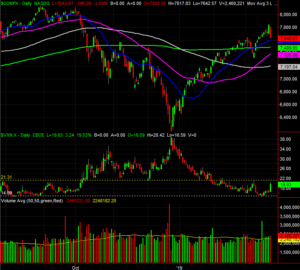
Source: TradeStation
Zooming out to the weekly chart of the S&P 500 puts things in perspective. It’s in this timeframe we can get a really good feel for just how rapid the rebound from the late-December low has been. It’s also on the weekly chart of the S&P 500 we can see last week’s bar was a reversal-oriented one, marked by a low open, a lower close, and a conspicuously high peak. This shape suggests a transition from a net-buying to a net-selling environment. The weekly chart also makes clear just how low the VIX is from a key bottom-making peak.
S&P 500 Weekly Chart, with Volume
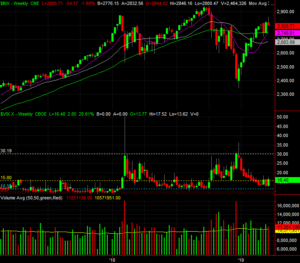
Source: TradeStation
Or, maybe not. As was noted already, this market environment has been one plagued with indecision thanks to political, trade and regulatory volatility that has left investors guessing as to what the future holds.
The smart-money move here is to wait. Namely, we’re going to wait and see how traders respond to Friday’s shocking stumble. Maybe it was a one-off. Or, maybe it’s a sign of the shape of things to come. It was, after all, the worst day we’ve seen in weeks, and took shape following one of the best and fastest rallies we’ve seen in years.
We know exactly what to look for though. The VIX is toying with a well-established ceiling, while the S&P 500 is touching a well-established floor. The volume is slowly but surely starting to lean in a bearish direction action. The bulls will get one, maybe two, chances to quell the brewing stumble. If that doesn’t happen, odds are good we’ll see at least a modest pullback. Even then though, there are several key moving average lines in view, each of which could stop the bleeding.
The VIX and VXN will tell is much more about the market than the market indices will for the foreseeable future.