Weekly Market Outlook – Knee-Jerk Rebound Leaves More Questions Than Answers
Weekly Market Outlook – December 8th, 2019
We’re starting this week’s analysis with a bigger-picture view via the weekly chart of the S&P 500, because perspective is needed to fully appreciate last week’s tumble and immediate bounceback (a bounceback that only adds to the confusion).
And yes, the market did bounce back last week from a very rough start. It was only a 0.1% gain. But, at the low point on Tuesday it was down a little more than 2.2%, struggling to hold onto its oversized gain from late September… a 10.4% gain. At the high from two weeks ago, the S&P 500 was up 34% from last December’s low. Granted, last December’s bounce started with the advantage of coming out of a major setback. Still, that’s a lot of ground to cover in less than twelve months.
S&P 500 Weekly Chart, with VIX
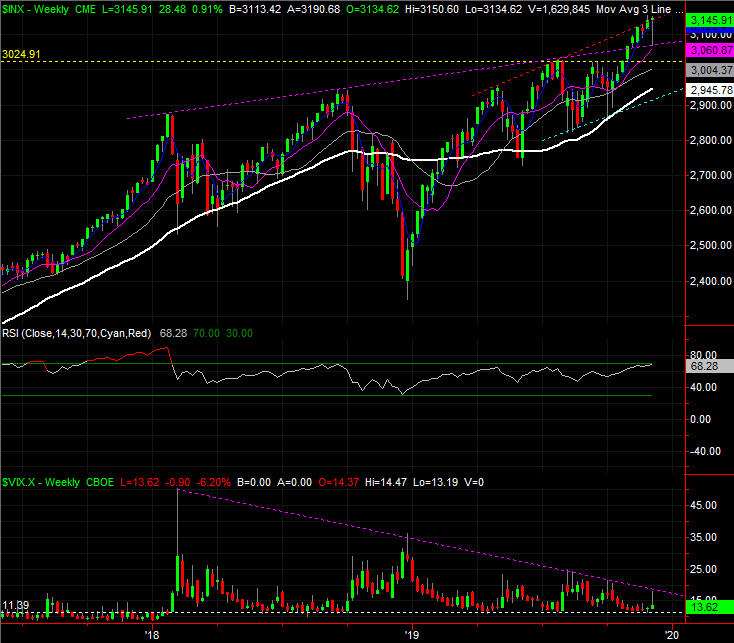
Source: TradeStation
The long-term look at the weekly chart also gives us something else we’ve been waiting on for a while… a clue from the VIX.
As one would expect, it’s been trending lower since the early 2018 bottom, but with no clear framework. That framework has emerged. It’s the falling purple, dashed line plotted across all the major highs going back to February of last year. The broad market may be overextended and due for a pretty significant correction — the RSI indicator is now as high as it was in September of last year, right before a big selloff. But, the VIX is going to have to break above its technical ceiling before the S&P 500 is going to be in a confirmed, corrective downtrend.
Now, zooming into the daily chart of the S&P 500 we can see the problem with planning on a pullback… there’s a ton of potential support below where the index is here. It starts with the 20-day moving average line (blue) at 3115 and ends at the 200-day moving average line (white) at 2935. Those lines and the 50-day and 100-day moving average lines are all prospective floors.
S&P 500 Daily Chart, with VIX and Volume
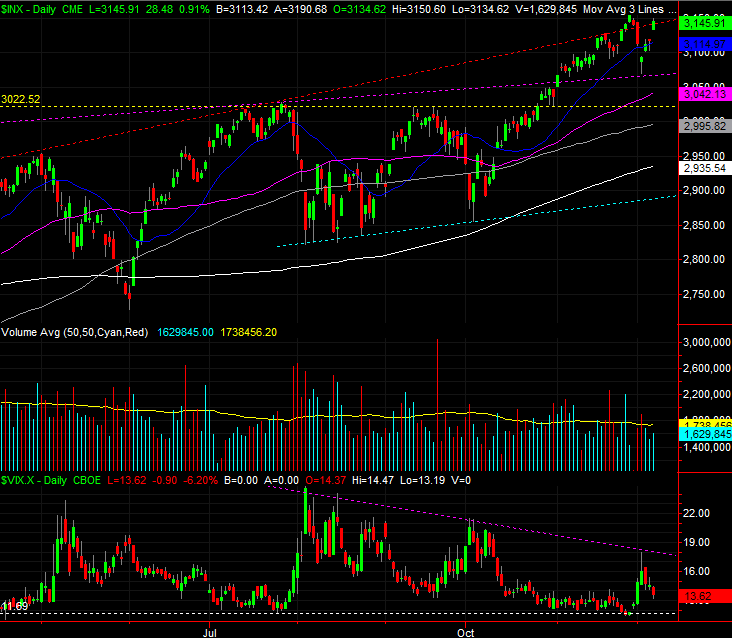
Source: TradeStation
Odds are the floors made by all those moving averages will be tested again. The market is overbought with two major gaps in the rearview mirror. And, while traders seem intent on making another Santa Claus rally this year, there’s not a lot of room left to keep moving higher. There’s a catch though. That is, there’s a huge disparity between where the upper floor is and where the lowest one is. The VIX could punch through its ceiling and it still wouldn’t be a market killer. The S&P 500 will remain in a technical uptrend until it falls under the support line connecting the August and October lows, plotted as a light blue line. Don’t mistake a stumble for the beginning of a bear market.