Weekly Market Outlook – THAT Was (Probably) the Knockout Punch
The most bullish aspect about last week’s action? Friday’s bearish gap, which might – MIGHT – set the stage for a rebound this week. That is, the effort to fill in the gap may inadvertently start a new bullish move, which might get traction. It seems like investors are willing to entertain bullish possibilities.
On the other hand, that’s not the ‘best’ bullish argument you want to be able to make, particularly after both of the key indices breaks below a pivotal long-term moving average as they did last week.
That makes what happens this week very important, though we should warn you to not over-react to the action right out of the gate. There’s (too good of) a chance the first lunge is going to be a fakeout, ultimately leading into a move in the other direction. In other words, early bearishness this week could soon put a big bottom and upside move in place. Conversely, a little bit of bullishness early this week may be a setup for an even bigger move to even lower lows. We’re in that sort of distrusting, “please prove me wrong” environment.
Take a look at the daily chart of the S&P 500 below. On Wednesday and Thursday, it looked like the 200-day moving average line (green) was going to hold up as support and fuel a rebound. As of Friday, it clearly didn’t.
S&P 500 Daily Chart, with VIX, Volume
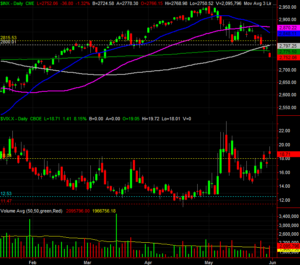
Source: TradeStation
Also note that of the past six trading days, the four most bearish ones were also the highest volume days. The two decent ones were on poor volume.
Zooming out to the daily chart of the S&P 500 puts things in perspective for us. This current setback looks an awful lot like the one from October, though hasn’t yet traveled as far. The image also shows the VIX has yet to make its way back to the 30-ish area that usually coincides with a major bottom, but it has punched through a more interim ceiling right around 18.7.
S&P 500 Weekly Chart, with Volume
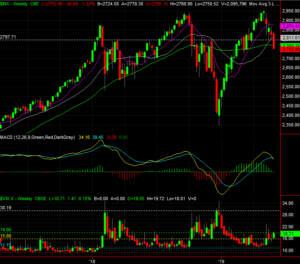
Source: TradeStation
All the same basic themes apply to the NASDAQ Composite. That is, the 200-day line here has been busted as well. Now we’re going to see if the bulls completely fold, or are ready to push back…
NASDAQ Composite Daily Chart, with VXN, Volume
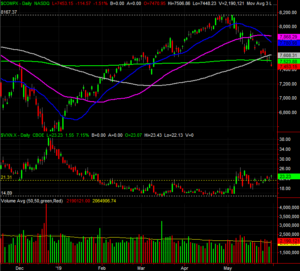
Source: TradeStation
… though it might take a couple of days for that dust to fully settle and for both sides to make a decision they can live with.
This is quickly turning into a psychological chess match. Superficially, the break under the 200-day moving average lines is bearish. In this particular case though, the bulls may push back. They’ll need to get the S&P 500 back above the 100-day moving average line (gray) to make any rebound fully take hold. If they fail to do that and instead let the S&P 500 slip back under its 200-day moving average line at 2775.5, that may be the move that inspires another more serious wave of selling.
If instead the S&P 500 plummets early this week, that may quickly be interpreted as too much, too fast, leading into a dead-cat bounce. How far such a bounce takes the index will depend, but in all cases, the 100-day moving average lines currently at 2811.6 is the line in the sand.
Whatever and whenever it happens, a VIX surge to near 30 should coincide with a major bottom.
–Price