Weekly Market Outlook – One Misstep Away From Trouble Or…
Two weeks ago, investors were cheering the impressive recovery. Stocks finished May on a sour note, hinting at more selling. The steep decline was abruptly ended before it had a chance to pick up steam though, with the S&P 500 moving back above the 200-day moving average line and then back above the 50-day moving average line (purple) early last week. However, once above that level, the rally effort came to a screeching halt.
S&P 500 Daily Chart, with VIX, Volume
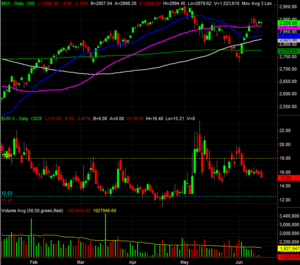
Source: TradeStation
It’s not thrilling, but serviceable. Except, the move isn’t being mirrored by the NASDAQ Composite. It bumped into its 50-day moving average line last week, but was unable to remain above it.
NASDAQ Composite Daily Chart, with VXN, Volume
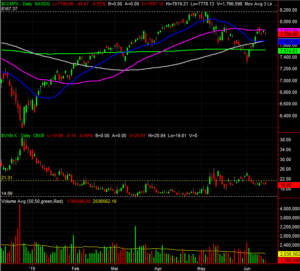
Source: TradeStation
Of the two indices, the NASDAQ is the one the bulls would want to see making more technical progress.
It doesn’t mean a whole lot. Last week’s daily volume was below average, and fell the whole time. Interest in the market at this time is modest, at best, and not especially bullish or bearish. The VIX is stabilizing too, at a relatively neutral 15/16 area. That’s something of a no-man’s land that sidelines a lot of traders. A break above 18 is still bearish, and a slide back to the 12-ish area also sets the stage for bigger bearishness. While the VIX is holding steady or falling toward the 12 level, however, is an opportunity for more bullishness.
That’s a concept that means more with the perspective offered by the weekly chart of the S&P 500.
S&P 500 Weekly Chart, with Volume
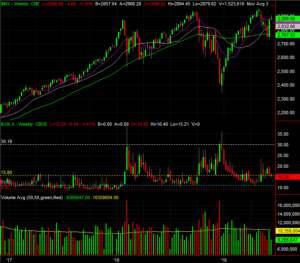
Source: TradeStation
The smart-money move here is to be patient. One side or the other will flinch soon enough, and we’re at an ideal pivot point right now. That is to say, there’s room and reason for the market to proceed up or down from here.
With all of that being said, also understand that the market could waffle for a few days while it figures out what’s next. For the S&P 500, that means the index could bounce around between the 200-day moving average line around 2775 and 50-day line at 2878 for a while before a break finally takes shape. That volatility is the market’s way of trying to unnerve as many traders before finally making a more prolonged move.
Just bear in mind that the action we’ve seen of late suggests a measured loss of bullish momentum and a test of the waters for a pullback. Keep your eyes peeled for crosses of shorter-term moving averages under longer-term ones. That’s going to prompt bearish interpretations, especially here at the time of year when stocks are lethargic at best, if not prone to weakness.
One day at a time.
— Price
Sign up here for more Weekly content from Price!