Weekly Market Outlook – A Far-From-Perfect Recovery Effort
It was a good week, but not the perfect recovery effort. Namely, as the closing bell approached on Friday, the bulls were starting to back off. The S&P 500 still managed to close above its 50-day moving average line, but just barely. It’s also curious that the VIX pushed a little higher on Friday.
S&P 500 Daily Chart, with VIX, Volume
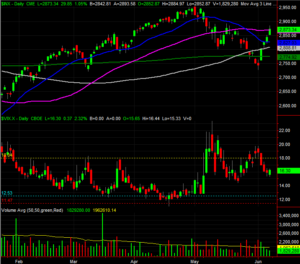
Source: TradeStation
Most noteworthy of all, however, is the way the daily volume continued to fade as the rally wore on. This effort doesn’t have very many backers or participants.
The daily chart of the NASDAQ Composite tells the same basic story.
NASDAQ Composite Daily Chart, with VXN, Volume
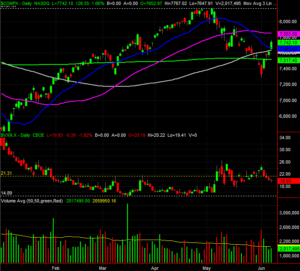
Source: TradeStation
Zooming out to the weekly chart of the S&P 500, unlike usual, offers some important perspective. Namely, it makes clear that last week’s gain wasn’t just big, but the biggest weekly gain we’ve seen since November. But – and the is the alarming part – the November gain ended up being a setup for a huge meltdown… just after a whole slew of people convinced themselves a relatively modest pullback was ready to come to a close.
S&P 500 Weekly Chart, with Volume
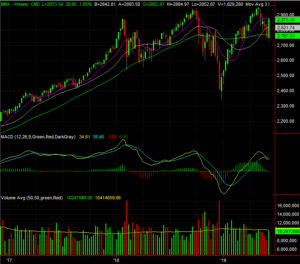
Source: TradeStation
That’s not to suggest that has to be the outcome this time around. It would be reckless, however, to ignore that distinct possibility this time around… particularly given the lack of volume behind the move.
Fortunately, all of this is taking shape near the critical moving average lines. The bulls and the bears will both get a chance to regroup here, and the moving averages should mark when and where either side of the table begins a more prolonged move. The 200-day moving average line, marked in green, is the key floor. At the other end of the spectrum is the aforementioned 50-day moving average line, plotted in purple, which turned into something of a ceiling on Friday.
The VIX, of course, is also on the radar.
We suspect this week will start off with some profit-taking, but don’t take it to heart. Unless the 200-day line fails as support, the market will remain on the fence.
At the other end of the spectrum, should stocks continue to make progress, that’s actually more problematic than doing nothing in that it sets the stage for even more pronounced profit-taking… the kind of profit-taking that could put traders into a prolonged panic mode that ends up crushing the market anyway.
In other words, the most bullish thing that could happen this week is actually a modest cooling that lets the bulls regroup and rethink.
The VIX is still a big barometer. The 18.0 level is the VIX’s make-or-break mark.
–Price