Weekly Market Outlook – How a Losing Week Was Still a Winner
Weekly Market Outlook – April 26th, 2020
Last week’s big victory was the S&P 500’s close above the 50-day moving average line (purple). The flaw in that victory was the distinct lack of volume behind it. There aren’t a great number of bulls right now. There are just fewer bears. Most people seem to be on the sidelines, waiting for the “other guy” to make the first move.
S&P 500 Daily Chart, with VIX and Volume
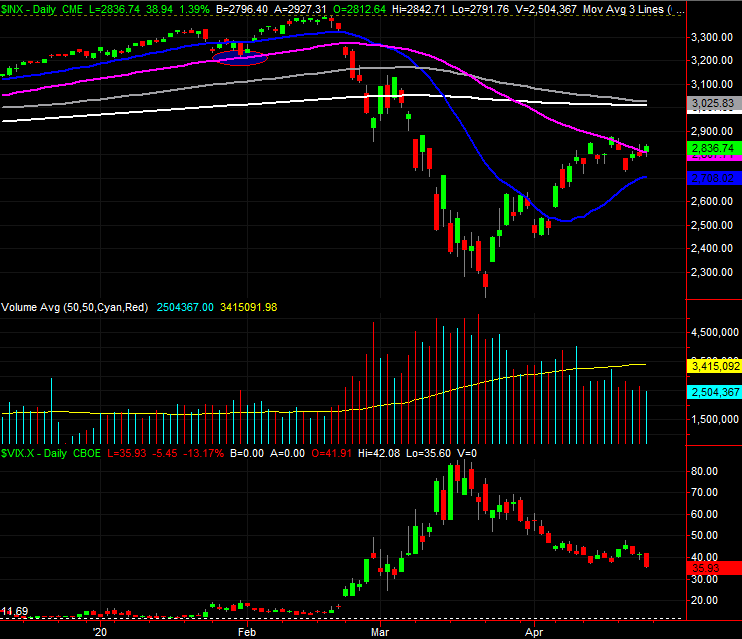
Source: TradeStation
The same basic idea applies to the NASDAQ Composite, save one big difference. The composite is above its 50-day (purple) and 200-day (white) moving average lines, but is clearly struggling with the 100-day moving average line (gray) at 8669. We’re just one good day away, however, from getting over that hump as well. Doing so could be catalytic.
NASDAQ Composite Daily Chart, with VXN
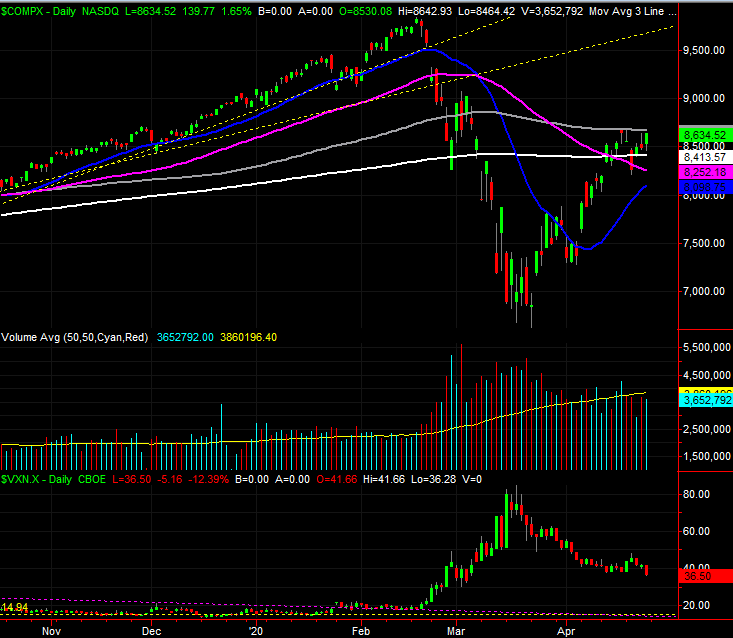
Source: TradeStation
There is one curious upside for both charts. In each case above, the volatility indices — the VIX and the VXN — renewed their downtrends last week in a pretty decided fashion. They may not be going “all in” with stocks, but through the VIX and VXN we can see smart money, hedge funds, and institutions are making slightly more bullish bets with options, or at least scaling back on their hedges against more bearishness. It’s bullish, in its own way.
Zooming out to weekly charts of both indices gives us a little more perspective on what’s happening right now, although it doesn’t change the reality that stocks are still mostly beholden to headlines. More than anything though, the weekly view highlights a couple of key lines in the sand that we might have otherwise overlooked.
For the S&P 500, it’s this timeframe that shows is the 100-day line (gray) is about to cross below the 200-day moving average line (white). The event itself isn’t all that interesting, but where those lines cross could be a factor. That area, once the two intercept, could be a particularly tough technical ceiling. It looks like it’s going to happen right around 3014.
S&P 500 Weekly Chart, with VIX and Volume
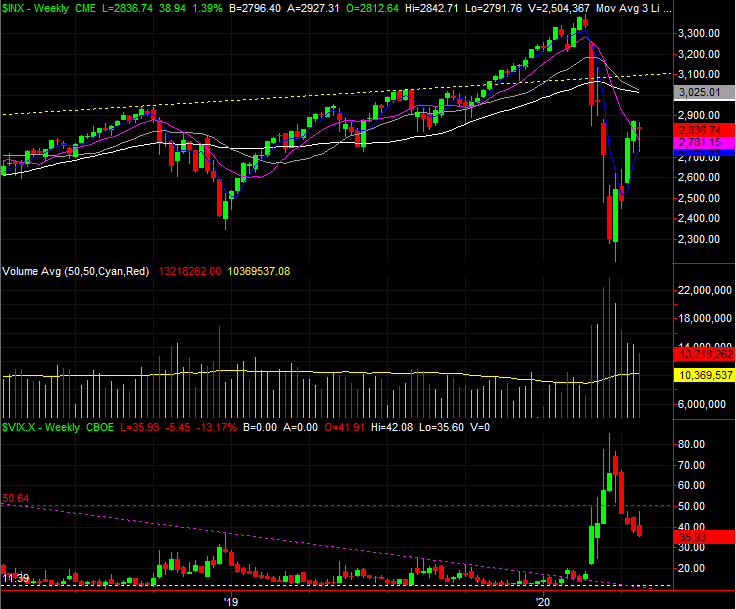
Source: TradeStation
The big highlight for the NASDAQ’s weekly look is a little bit different. Here we can see the index has already been struggling with the 8630 area, which is a near-perfect 5/8 (61.8%) Fibonacci retracement of the entire February-March pullback. This is where one would expect to see some significant pushback.
NASDAQ Composite Weekly Chart, with VXN
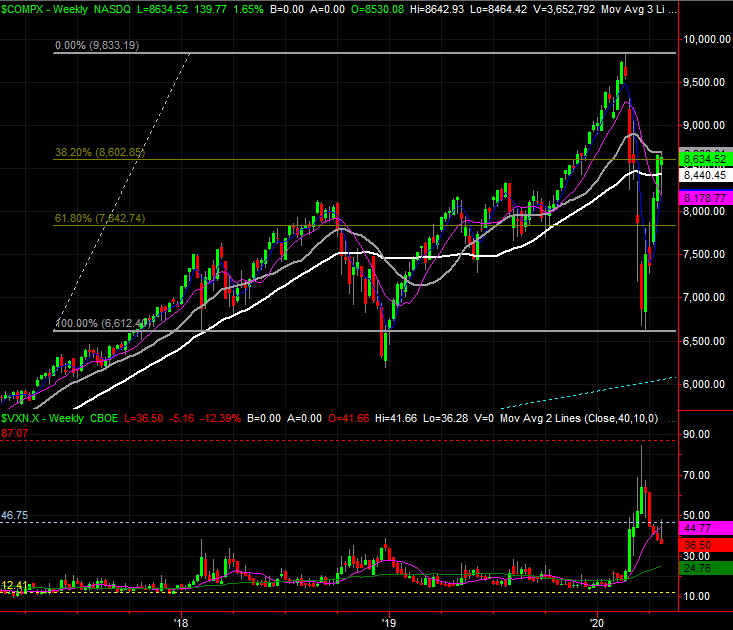
Source: TradeStation
The pause here isn’t necessarily an indication that stocks are going to roll over. They might, but that’s not the point. This is just the most opportune place for the bears to push back. The bulls could still keep fighting until they punch through. In some ways that would actually be a very bullish outcome. It would prove the advance can overcome adversity.
More than anything else right now though, we just have to accept that COVID-19 is the big driving force. That means the undertow can change direction with little to no warning.