Weekly Market Outlook – Each Step Forward is Getting Tougher to Take
Weekly Market Outlook – December 15th, 2019
The bulls are charging, but each advance pushes the market closer to its eventual top. If we’re not there yet, we’re uncomfortably close.
This week’s analysis starts with a distant look at the NASDAQ Composite’s weekly chart. It’s only from this view can we see just how far the market has come since the early October bottom. It’s also from this view we can see that, despite last week’s gain of 0.9%, the rally is still slowing down. To quantify that idea, the NASDAQ’s close of 8734.88 is now 8.2% above the 200-day moving average line (white) at 8070.61, which is about the maximum divergence it’s capable of achieving without peeling back.
NASDAQ Composite Weekly Chart, with VXN
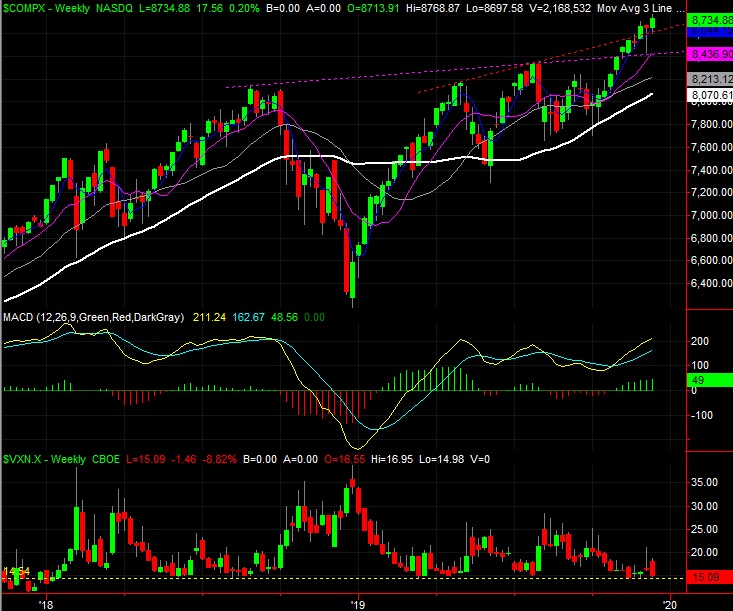
Source: TradeStation
Zooming into the daily chart of the NASDAQ reveals a couple other critical details. One of them is the pullback from the intraday highs from Thursday and Friday. Both days were winners on a close-to-close basis, but both days’ closes were well off the intraday high, suggesting the bulls were at least a little bit hesitant. The other critical detail? The VXN is back to what’s something of an absolute low around 15.0, which is where it’s found a bottom at recent market peaks.
NASDAQ Daily Chart, with VXN and Volume
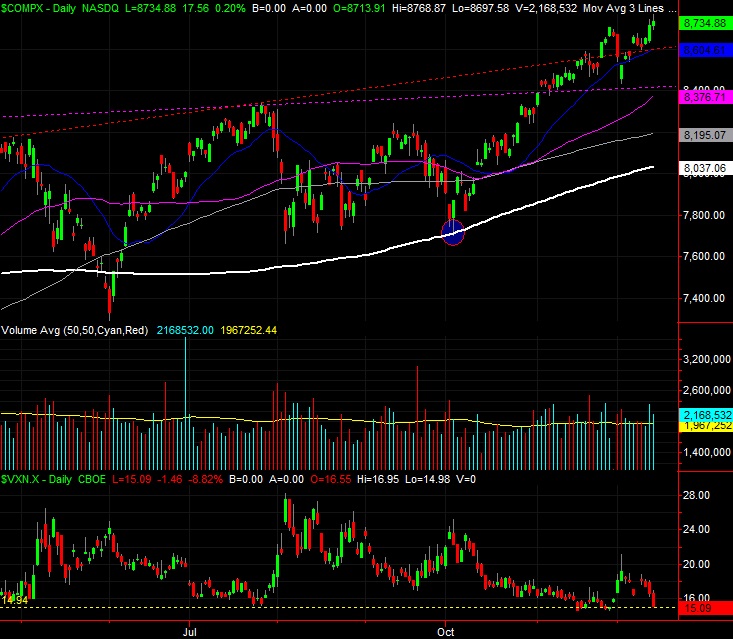
Source: TradeStation
The flipside: The volume behind the past couple of bullish days was above average, hinting that there may be some decent buying interest after all. Ditto for the S&P 500’s daily chart, in both regards.
S&P 500 Daily Chart, with VIX and Volume
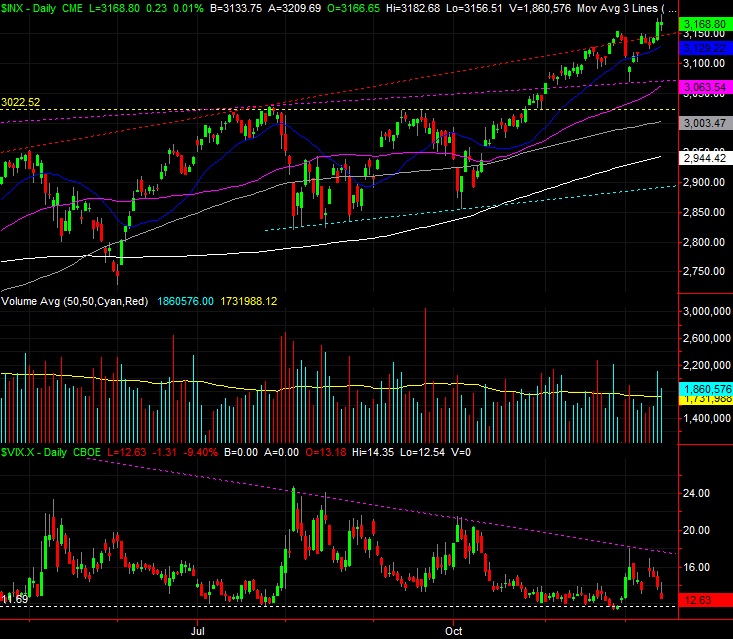
Source: TradeStation
Except, maybe the volume swell from Friday wasn’t nearly as bullish as it seemed. Ferreting out the NYSE’s up and down volume as well as its advancers and decliners reveals that, despite the S&P 500’s small gain, there was a little more bearish breadth and depth than bullish breadth and depth. That wasn’t the case at all on Thursday, nor has it been the case for most of the month. Nevertheless, there’s been a growing imbalance of the market’s advancers and up volume compared to its decliners and its down volume.
This is best illustrated by the Arms Index, sometimes called the TRIN Index, of the NYSE’s daily breadth and depth data. More specifically, it’s best illustrated by a moving average of the daily TRIN/Arms Index numbers, which helps identify the broad trend.
The graph below compares the S&P 500 to a 20-day moving average of the NYSE’s daily Arms Index value (red). When that indicator gets “too low,” it usually marks at least a noteworthy top. The TRIN average is creeping into “too low” area right now, telling is the advance since the beginning of October hasn’t unfurled on a healthy balance between volume and breadth (advancers/decliners).
S&P 500 Daily Chart vs. NYSE Arms Index (TRIN)
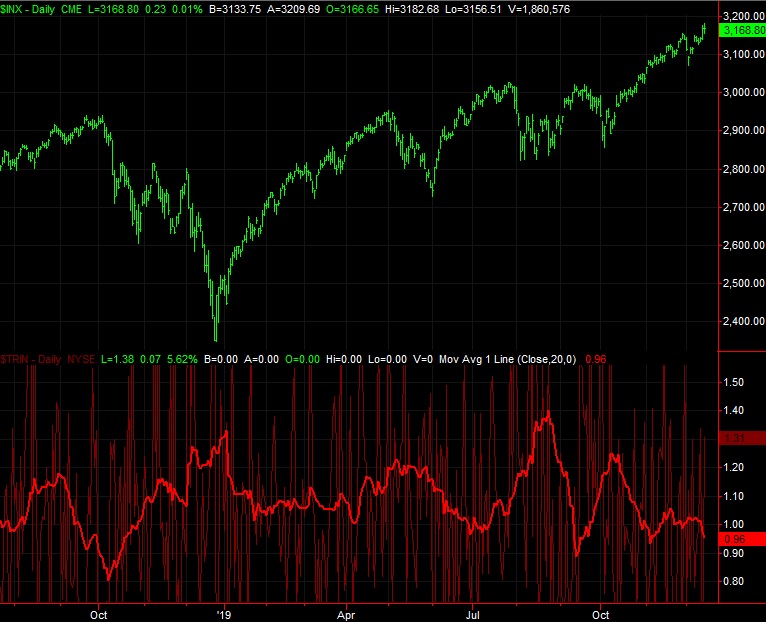
Source: TradeStation
The downside of reading bearishness into the TRIN reading is simply that it’s not a laser-precise timing tool. The stage is set, so to speak, but the bears will need to make a point of tilting the scales in a bearish direction. They’ll do it eventually, but they may hold off on doing so until they’re done working on their Santa Claus rally.
Whatever the case, the first lines in the sand are clear. The S&P 500’s 20-day moving average line at 3129.2 (blue) is a floor until further notice, and past that, the 50-day moving average line (purple) at 3063.5 will likely hold up as support. If and when those lines break, then we’ll reassess. First things first though.