Weekly Market Outlook – Despite the Drubbing, Last Week Was a Winner
Weekly Market Outlook – March 8th, 2020
Normally we’d begin our analysis with a look at a weekly or daily chart of a key index — usually the S&P 500 — first looking at the most important and most telling of the clues that chart gave us. This week’s look is going to be a rare exception though, beginning with a look at the monthly chart of the S&P 500. This is appropriate, as that’s how much the market has moved in just the past two weeks. We’re at multi-month lows.
That’s not the only reason we’re starting with the long-term view, however. It’s the monthly chart that shows us something else quite curious about the recent selling, and where the bulls finally drew a line in the sand. Last week’s lows from the S&P 500, around 2856, are almost a perfect 38.2% Fibonacci retracement of the rally seen from the 2014/2015 floor established right at 1800.
The same monthly chart also shows us the Volatility Index’s peak around 49.0 last week touches a ceiling that’s been established (although rarely touched) beginning in 2010. Most, though not all, of the sharp surges from the VIX marked the beginning or renewal of market rallies. It’s an indirect indication that most traders have decided the worst-case scenario will inevitably play out, so they’ve dumped all the long/bullish trades they feel they can’t hold onto.
S&P 500 Monthly Chart, with VIX
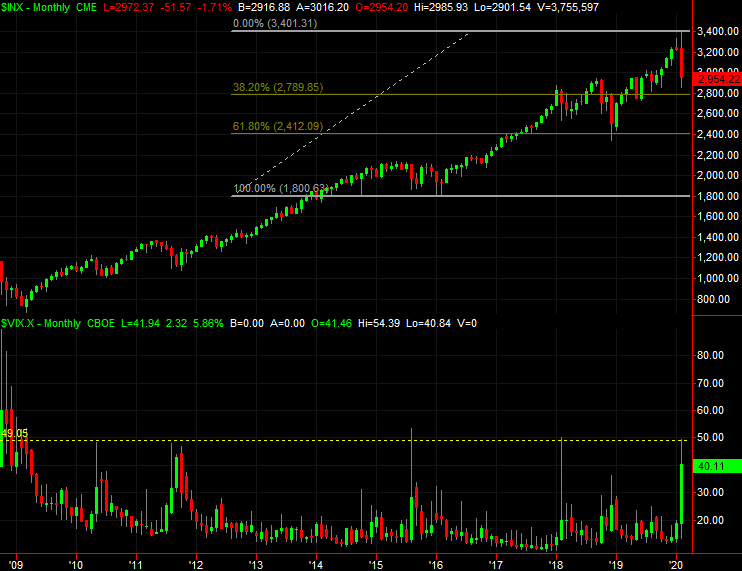
Source: TradeStation
These clues aren’t quite as a apparent on the weekly chart of the S&P 500. In fact, the weekly chart leans in a bearish direction despite last week’s modest gain. That’s because we can see on the weekly chart that the index has now made its second weekly close under the 200-day moving average line (white) after briefly crossing back above it last week. The weekly chart also shows us that the S&P 500 is right at the rising support line (blue, dashed) that connected the lows in August and October of last year.
S&P 500 Weekly Chart, with VIX and Volume
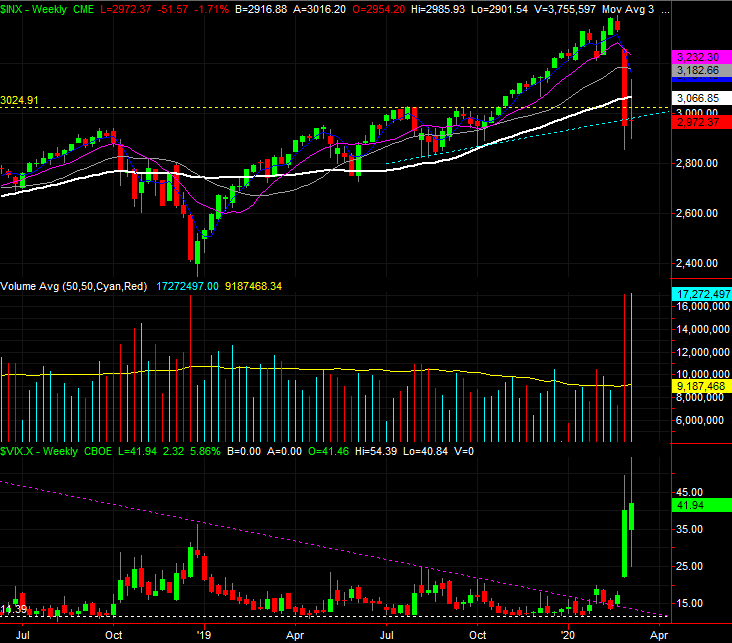
Source: TradeStation
Zooming into the daily chart of the S&P 500 tilts the scale back in a slightly bullish direction, for a handful of reasons. One of them is the fact that in this particular timeframe we can see the index is actually holding above that dashed, blue support line that came into existence in the fall of last year.
Perhaps the biggest of the bullish clues on the daily chart, however, is the shape of Friday’s bar. Although it started and ended the session in the red compared to Thursday’s close, it also closed near the high, and well above the intraday low. This is a hint that the last of the prospective sellers were flushed out mid-day, leaving nobody but the prospective buyers behind. Curiously, this hammer-shaped bar is how we ended the previous week, right in front of Monday’s huge gain.
S&P 500 Daily Chart, with VIX and Volume
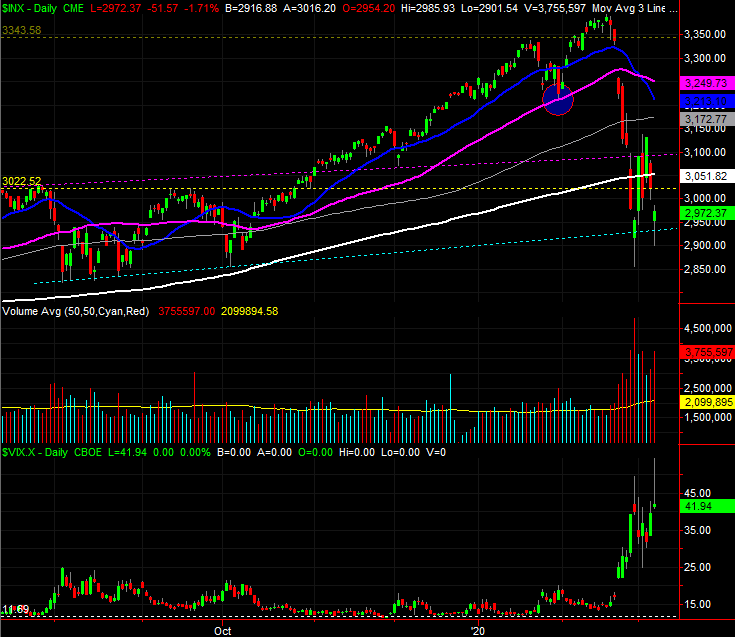
Source: TradeStation
This nuance can’t be dismissed. Aside from the fact that we saw the exact same thing a week earlier right before a major advance, the last few hours of the trading week are arguably the most important. That’s when traders have to decide if they’re going to own stocks into a weekend when they can’t sell them. Even in the middle of coronavirus mania, traders were actually plowing back into names… just in case the world doesn’t end.
Friday’s opening gap sets the stage for a little bullish pressure as this week gets going too, and note that the VIX logged a reversal-shaped bar on Friday as well. This suggests its pivot from an uptrend to a downtrend has already started.
Take it all with a grain of salt. Stocks are still mostly news driven, and the only news being circulated at this time is about the coronavirus contagion. It can push and pull stocks — and reverse their course — with little to no warning. In essence, this is still a coin toss. There’s going to come a time, however, when investors stop responding to the hysterics. That’s when the technical lines in the sand will start to matter more. Until then, don’t dig in too deep on either side of the fence.