Weekly Market Outlook – Bending, But Not Breaking
Weekly Market Outlook – January 5th, 2019
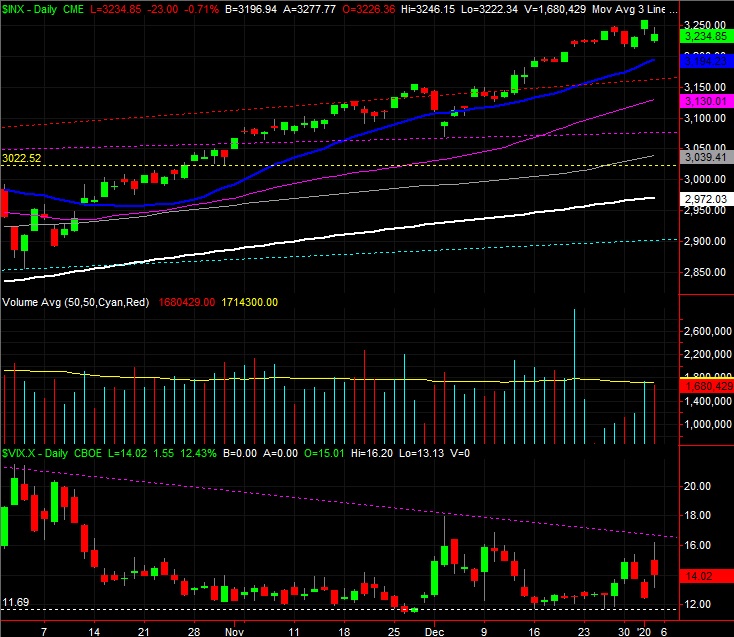
It could have been worse on Friday, and for a short while, it was. Though the S&P 500 still ended the session down to the tune of 0.71% on the last trading day of last week’s holiday-shortened trading action, the close of 3234.85 was still notably above the low of 3222.31. The stumble also failed to threaten any key support levels, including the 20-day moving average line (blue) at 3194. The market’s overbought to be sure, but this is hardly evidence that the would-be sellers are ready to do any real damage.
S&P 500 Daily Chart, with VIX and Volume
Source: TradeStation
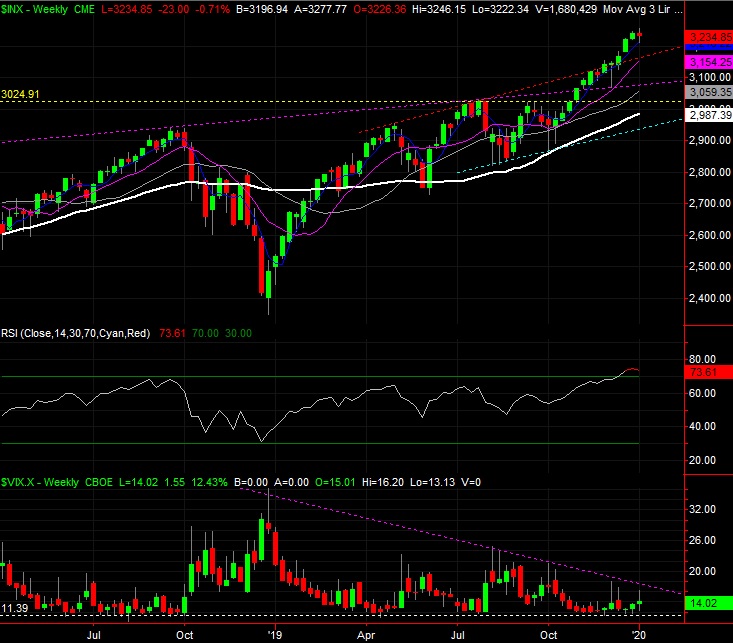
We do see some red flags when we zoom out to the bigger-picture perspective of the weekly chart though. Namely, last week’s full-week bar as a spinning top, or doji, where the open and close are more or less the same and more or less in the middle of the high-to-low range. These shapes are often indicators of a pivot point, from a net-bullish to a net-bearish situation in this particular case; the doji is the point of equilibrium. The only fault with this one is the fact that the open and close weren’t completely above the previous week’s close of 3240. A doji or spinning top positioned above that level would have really suggested a “last gasp,” so to speak.
S&P 500 Weekly Chart, with VIX and RSI
Source: TradeStation
The weekly chart puts another important item front and center… the VIX. It didn’t break above the falling ceiling that’s guided it lower since the late-2018 peak. But, it did hint at a test of that resistance by virtue of its second weekly higher high. If that ceiling doesn’t hold the VIX down at the same time the S&P 500 itself starts to break under any of its technical floors, that’s a problem.
On the other hand, it’s not exactly a huge problem. There are support levels peppered all between 3194 and 2900 for the S&P 500, any and all of which could bring an end to any wave of selling. It doesn’t exactly matter how due — or by how much — the market is due for a correction.
That being said, a slide back to the 2900 area where the lowest of any technical floor now lies would actually be of benefit, cooling the market off and setting up what should be a pretty good run for the rest of 2020. The only question is, will investors let the market only give up “a little” ground. The pullback that started to take shape in October of 2018 looked like it would become a nice, run-of-the-mill pressure release, but it quickly turned into a meltdown that proved out of control. Traders’ psyches are a little more on edge than usual right now… one of the problems keeping a lid on rallies as well.
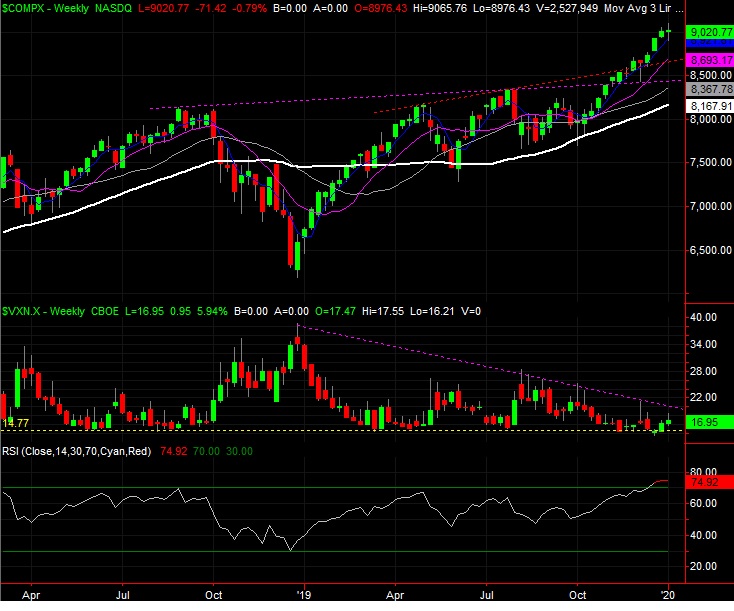
Same basic story with the NASDAQ Composite and the VXN. It pushed its way into an overbought situation thanks to the early October rally, and the VXN is contending with a felling ceiling of its own. There’s a doji/spinning top in place now here as well. Until the composite actually starts to smash through some floors though, we don’t want to read too much into the clues we’ve been given. The market’s given us plenty of headfakes in the past, including the recent past.
NASDAQ Composite Weekly Chart, with VXN
Source: TradeStation
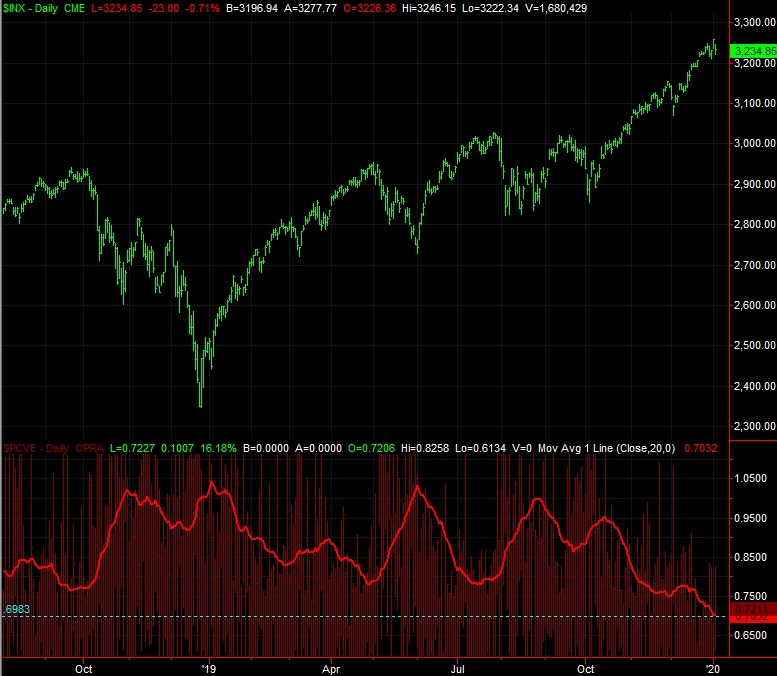
One last thing to put on your radar this week that we can’t yet dive fully into — the market’s put/call ratio (equity-only products) ended the year as low as it’s been in months. We could chalk it up to end-of-year rolling off of expired positions and into new ones, but we didn’t see that happen last year. Regardless of the reason, the options market is saying traders are more optimistic and less worried now than they’ve been in a long, long time. This is the kind of complacency that comes back to bite you when you least expect it.
S&P 500 Daily Chart, with Put/Call Ratio Trend
Source: TradeStation
No matter what, if we see the put/call line form a clear “V” shape, there’s lots of room and reason for selling. Stay tuned on this front.