Weekly Market Outlook – That’s What Happens When You Play With Fire
Weekly Market Outlook – August 26th, 2019
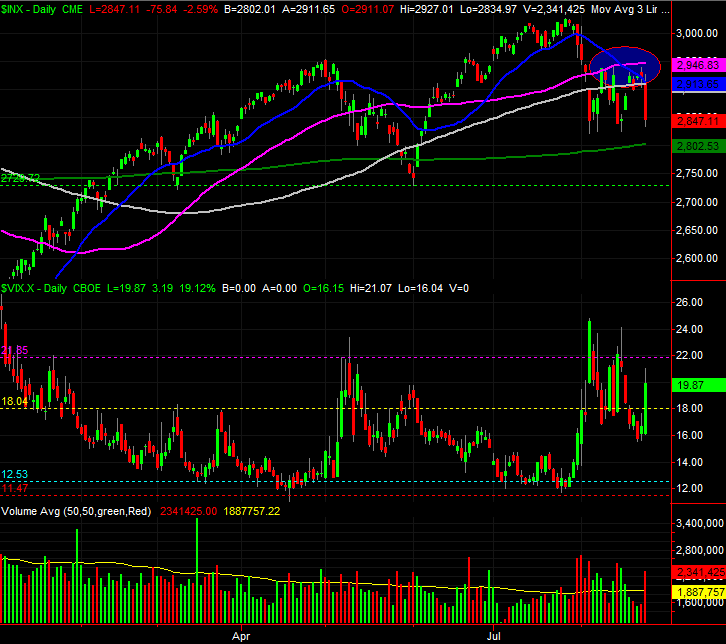
Good news, and bad. The bad news is, the 50-day moving average line (plotted in purple on the daily chart of the S&P 500 below) served as a resistance line last week, helping to prompt Friday’s meltdown. The good news is, the green 200-day moving average line has yet to even be tested as a floor. More good news … the VIX is nearing a more absolute ceiling near 30, which tends to be reached when the index is making a major bottom. Ideally, the VIX will hit 30 and the S&P 500 will find support at its 200-day moving average line at the same time, and mark a pivot back into a bullish mode.
S&P 500 Daily Chart, with VIX, Volume
Source: TradeStation
That’s the best outcome investors can hope for here anyway. Whether or not things will work out that way remains to be seen.
Working against that best-case-scenario outcome is the calendar, in more ways than one.
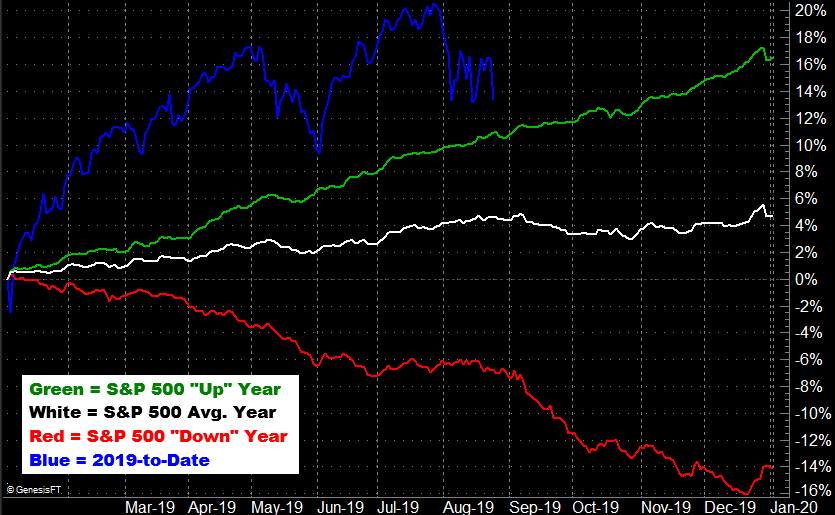
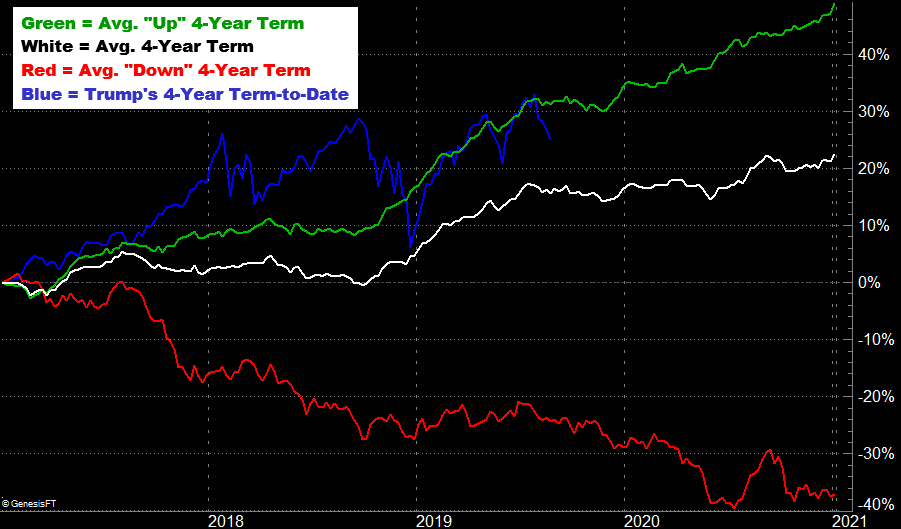
The images below have been discusses before, but merit refreshed look. They’re a comparison of where the S&P 500 currently is versus where it normally would be at this time of year, and where the index would usually be at this point in the third year of a Presidential term. Annually, this month and next are generally weak times for the market. Following the four-year Presidential term schedule, stocks should be weak through November.
S&P 500 Performance vs. Average Year
Source: TradeNavigator
S&P 500 Performance vs. Average Presidential Term
Source: TradeNavigator
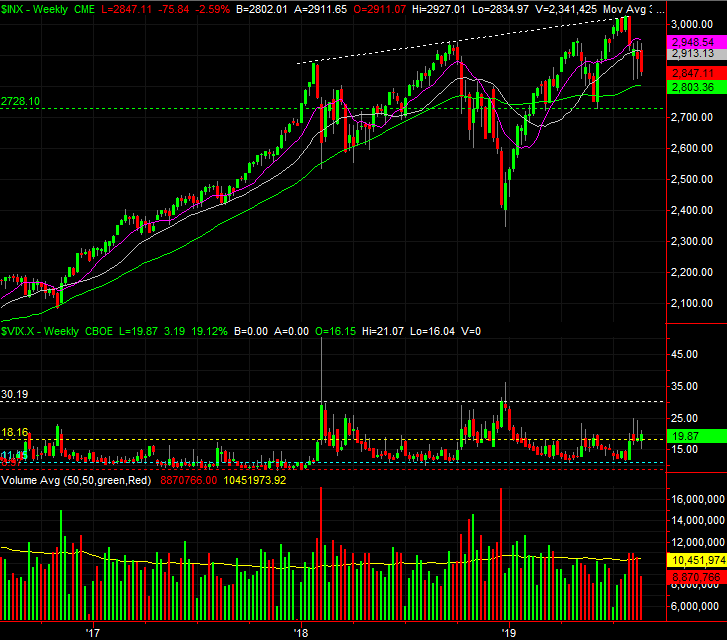
With that as the backdrop, zooming out to the bigger-picture weekly chart suddenly makes a lot more sense. Though the recent selloff has felt ugly, the truth is, it’s not been that dramatic. The 6% stumble doesn’t even yet qualify as a full-blown correction, which tend to be closer to 10% selloffs.
And where might a 10% setback leave the S&P 500? Somewhere around 2721, where a green line is plotted on both the daily and the weekly stock charts. That’s essentially where the index made key lows in March and then again in June.
S&P 500 Weekly Chart, with VIX, Volume
Source: TradeStation
In some ways that prospective floor is a healthier, better one than the 200-day moving average line at 2802. A move to the lower boundary would give the market more time to work through the likely calendar-based weakness, and it would also give the VIX more time to make its way to 30 – or perhaps even higher – where it usually has to reach to mark a major, trade-worthy bottom.
Or, perhaps a move to 2721 still isn’t enough to turn into a full-blown capitulation.
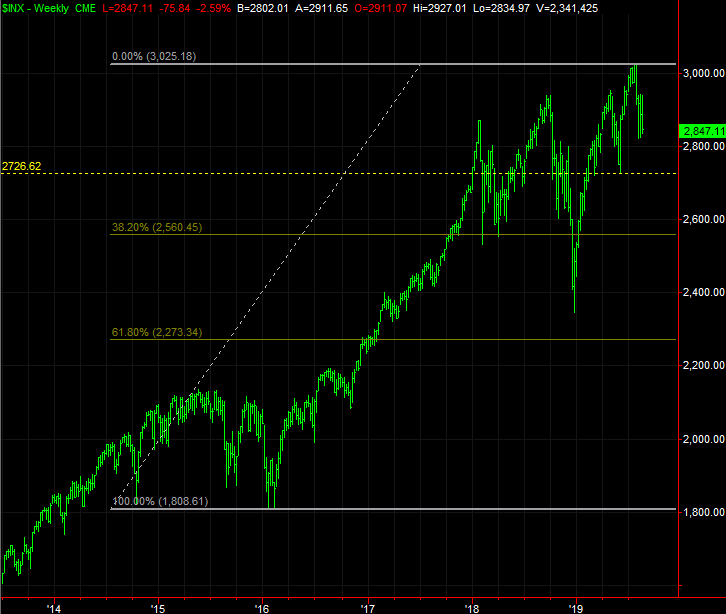
It’s more of an acknowledgment of a possibility than a prediction, but the next most noteworthy Fibonacci retracement line in play is the 38.2% retracement of the span between 2016’s low and 2019’s peak, at 2580. Curiously, that level was an important support level in early 2018 (though that meant nothing in December of last year, when the index plunged to 2347.
S&P 500 Weekly Chart, with Fibonacci Retracement Lines
Source: TradeStation
Or, maybe there’s no more downside at all. This market, if nothing else, has been very capable of doing the unexpected.
On balance though, the most fruitful viewpoint is one that the market now needs to prove its worth, rather than the other way around. That makes the most important task now figuring out where the ultimate floor will be found. We’ve lead out three plausible ones, although ‘when’ is going to be just as tricky to identify as ‘where.’ The turn could be pushed back as far as November, if there’s a turn to be made.


