Weekly Market Outlook – This is Where the Bulls Have to Put Up or Shut Up
Though the market has made a couple of record-high closes within the past week, it’s not decisively moved to record intraday highs. Indeed, it’s suspiciously peaked almost exactly where it peaked in September and October. The pause may only be for psychological reasons, but they’re major psychological reasons. The ceiling is plotted in white on the daily chart of the S&P 500 below, right around 2941.
S&P 500 Daily Chart, with Volume
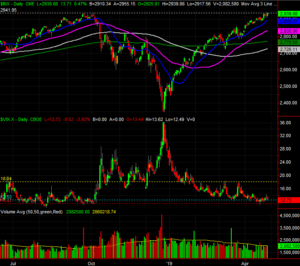
Source: TradeStation
The index is overbought. Of that there can be no doubt. The question is, does it matter? Although the VIX is near what is effectively an absolute floor around 11.0, it was near that floor around the middle of last year, and hovered around 11.0 while the S&P 500 continued to climb through September. But…
… there’s another way of gauging how far is too far.
As of Friday’s close, the S&P 500 is now 6.1% above its 200-day moving average line, plotted in green. When the index peaked in September, it was 6.5% above the 200-day average. The numbers aren’t exactly the same, but the point is – this divergence has reached rarely-seen and rarely-sustained proportions.
That’s not necessarily a call for a pullback. It’s likely, though not a foregone conclusion. It’s the groundwork for another relevant discussion either way, however. That is, if the resistance at 2940 is going to broken, it will almost certainly have to be a meltup that makes it happen (and you’ll likely have noticed the meltup rhetoric has picked up steam lately). While that sort of rally can be fun, they’re also usually short-lived. In this instance, one ‘last hurrah’ could set the market up for a huge wave of profit-taking.
Zooming out to the weekly chart of the S&P 500 puts that idea in perspective. While it had the advantage of starting out after a harrowing Q4 rout, the 25% bounce from the late-December low is one of fastest four-month rallies on record. The market’s already overextended. A meltup would push the matter into unprecedented territory.
S&P 500 Weekly Chart, with Volume
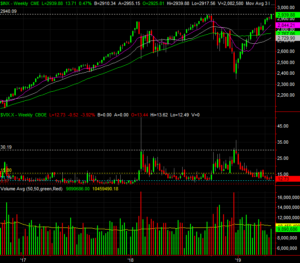
Source: TradeStation
Point being, be careful what you ask for.
The NASDAQ Composite, by the way, is in the same basic situation. September’s peak around 8137 is being tested, but has yet to be crossed. Traders may be wondering which outcome they’re supposed to make happen here at this pivotal time. The put/call ratio and Arms Index readings, by the way, are also sending mixed messages, underscoring the idea traders are hesitant to commit to a trade in either direction.
NASDAQ Composite Daily Chart, with Volume
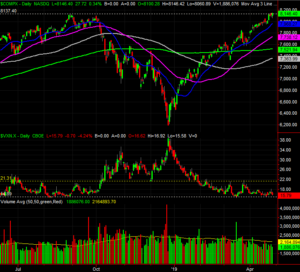
Source: TradeStation
Also to the extent it matters, the S&P 500 is now valued at a trailing P/E of 19.37 and a forward-looking P/E of 17.23. We’ve seen higher on both fronts, but not much higher for very long. Again, it’s making traders confused about what they’re supposed to do here.
With all of that being said, know that despite Friday’s respectable, robust bullishness, the recent undertow has been anything but bullish. The amount of daily bullish volume has been dwindling since the beginning of the month, and the amount of bearish volume has grown. In fact, though Tuesday and Friday were exceptions – perhaps telling exceptions – the number of daily advancers has dwindles since the middle of the month, and the number of decliners has grown. It’s too soon to call a couple of good days a complete change of heart.
S&P 500 Daily Chart, with NYSE Advancers, Decliners, Up and Down Volume
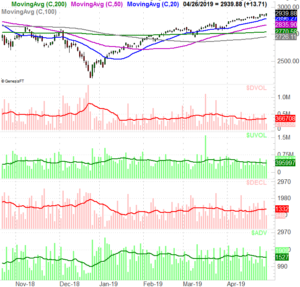
Source: TradeStation
Our outlook is a cautious expectation of a pullback, though it doesn’t necessarily have to be a big one. There are several moving average lines immediately below, any of which could stop the bleeding quickly enough. We’re still fully conceding, however, the market is in a good position to renew the rally, and traders are of a mindset where they care less about fundamentals and more about headlines. Let’s just hope any breakout thrust isn’t just the bears’ way of giving would-be buyers a headfake, only to unload on them.
— Price