Weekly Market Outlook – A Miserable Week Ends With a Glimmer of Hope
Weekly Market Outlook – March 1st, 2020
Let’s start this week with a look at the weekly chart, just to paint the full, crazy picture. The plunge was abnormally-sized, dragging the index below any prospective vestige of support.
S&P 500 Weekly Chart, with VIX and Volume
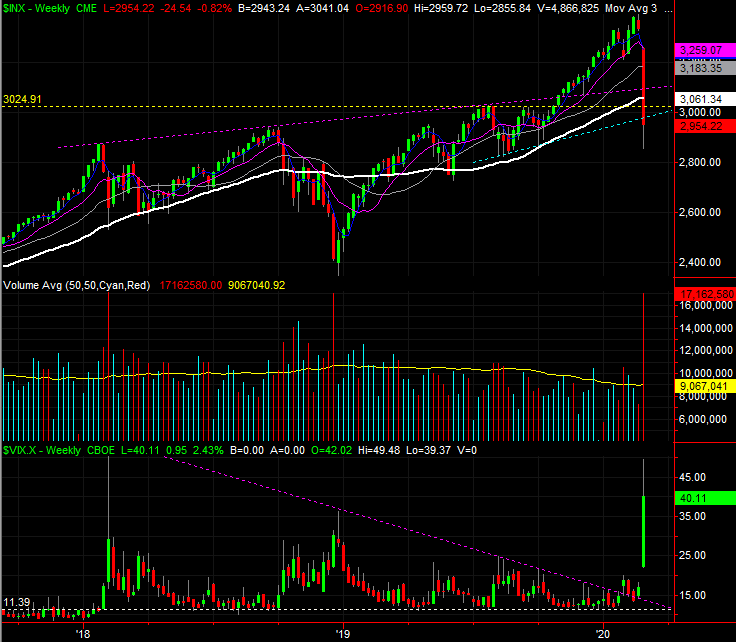
Source: TradeStation
Under normal circumstances this would flag more downside. These are anything but normal circumstances though. These are crazy times, and more often than not of late, extreme selloffs have been met quickly with similarly extreme bouncebacks.
In that vein, take note of two big pieces of information on the weekly chart. One is, the VIX raced to a multi-month high of 49.5 last week. When it spikes like that, it usually does so at a trade-worthy bottom.
The other interesting detail about last week… volume spiked too. Volume surges have also coincided with big volume surges. It usually indicates all the prospective sellers were flushed out, in a hurry.
The daily chart offers a couple bullish clues of its own. First and foremost is the shape of Friday’s bar. It’s a ‘hammer’ (in candlestick parlance), though the pattern goes by a couple of other names. The underpinnings are the same either way though. That is, the last of the would-be sellers were flushed out on Friday afternoon, then with no one left who was willing to put up a fight — and with bargain hunters finally ready to nibble — the tide turned in a matter of minutes. Such decisive, sweeping intraday reversals tend to mean something.
S&P 500 Daily Chart, with VIX and Volume
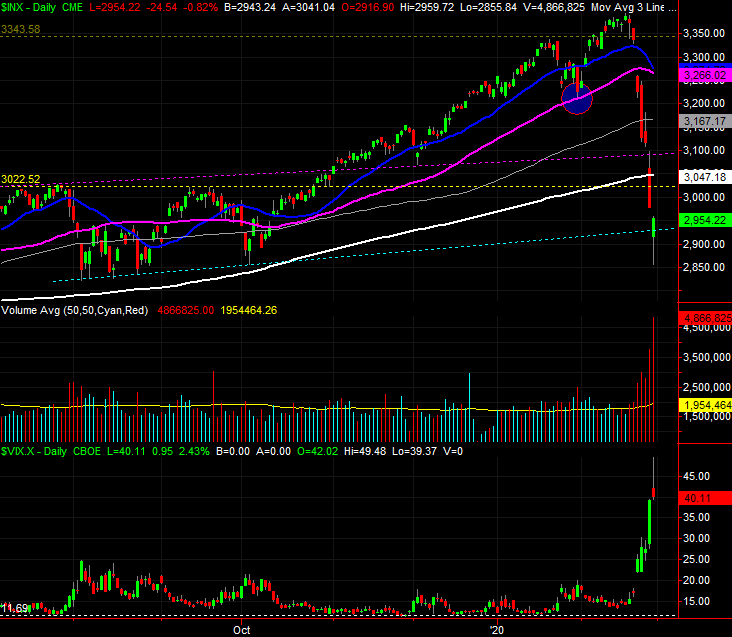
Source: TradeStation
Fanning those possibly-bullish flames are now three different bearish gaps, the last of which is still in place from Friday’s lower open. The market doesn’t like to leave gaps unfilled.
The same basic analysis applies to the NASDAQ Composite, but with a couple extra bullish nuances.
One of those nuances is the way the composite reversed its selloff right around the time it bumped into the 200-day moving average line plotted in white on the weekly chart below. More important, notice how often the same long-term moving average line has been a technical floor before (with the one exception of late-2018).
NASDAQ Composite Weekly Chart, with VXN and Volume
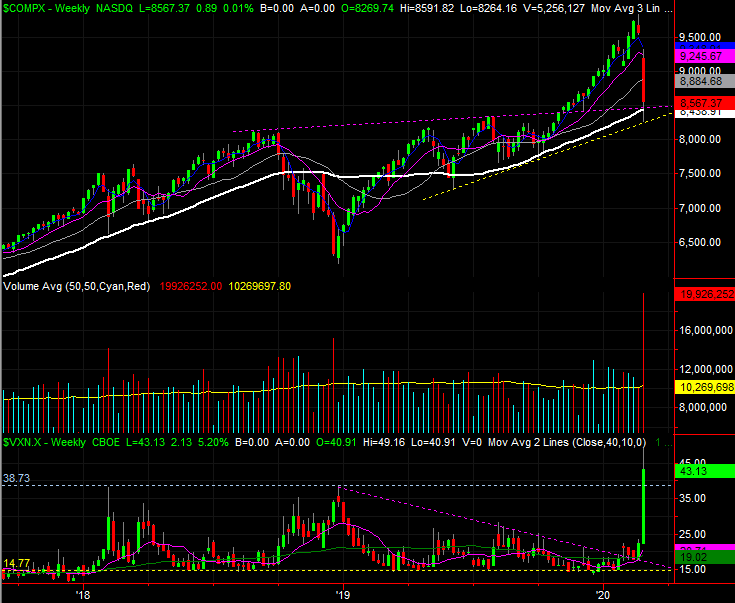
Source: TradeStation
The stage may be set for a bounce, but the reversal effort so far is fragile. It could look as if stocks are going to continue rallying from here, but that may not be a move meant to last. The indices have a lot of technical ceilings — lines that used to be support — to get the advance going in earnest again. Conversely, should any advance effort peter out and we end up making lower lows, that may well spook another new batch of sellers into action.
The hard part is not flinching, especially when it looks like you’re missing opportunities. Just stay disciplined. Don’t force things.