Weekly Market Outlook – Pullback Averted For Now, But Gains Still Weigh
Not bad. The market was dancing with the idea of a pullback, logging three straight days of lower highs after Monday’s pop. When they had to make the tough decision headed into the weekend though, investors felt the biggest risk was not being in the market. Friday’s gain of 0.69% left the S&P 500 at its highest close since early November.
Still, there’s no getting around the reality that stocks are due for a cooling. But, so far, the bulls haven’t even been willing to let the market even slide just a little bit. The S&P 500 is now up 19.5% from the late-December low… a rally that’s been mostly uninterrupted.
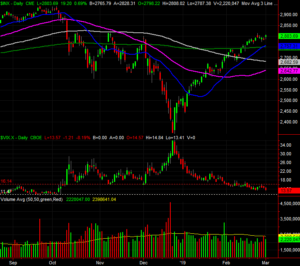
Take a look at the daily chart of the S&P 500. It crossed back above the last of the key moving average line – the green 200-day moving average line – and managed to remain above it last week. While that doesn’t guarantee stocks can’t make a good-sized pullback from here, the longer it can remain above the floor, the more likely investors will be willing to keep it near its current levels in the event of a pushback.
S&P 500 Daily Chart, with Volume

Source: TradeStation
It’s not the ideal situation for the bulls, for a couple of reasons. One of them is the fact that the VIX’s close at 13.6 on Friday leaves it uncomfortably close to a more absolute floor around 11.50. That leaves stocks a little more plausible room to keep moving higher, but not necessarily a whole lot higher.
The other reason? Despite the continued gain through Friday’s close, the volume behind the rally remains less than robust.
Not so with the NASDAQ Composite, where it really counts.
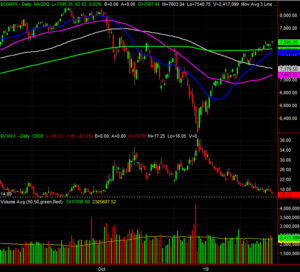
It’s been explained before but merits a revisit now… the NASDAQ Composite leads the market higher and lower. Its current looks much like the S&P 500’s, but with more bullish volume.
NASDAQ Composite Daily Chart, with Volume

Source: TradeStation
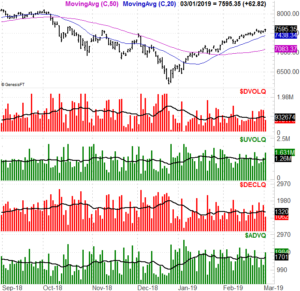
The graphic below breaks out the NASDAQ’s advancers and decliners, and its up volume and down volume; the black moving average lines overlaid on each data set make clear that on Friday, breadth and depth were decidedly bullish. Yet, even earlier in the week the NASDAQ’s breadth and depth weren’t overwhelmingly bearish.
NASDAQ Composite Daily Chart, Advancers/Decliners, Up/Down Volume

Source: TradeNavigator
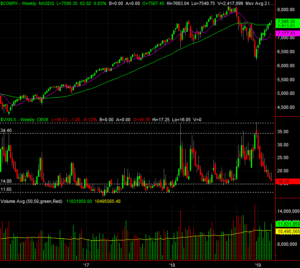
Still, the NASDAQ’s volatility index, the VXN, is getting uncomfortably close to a floor around 14.9… a reality made clear from a weekly perspective. The weekly chart also shows is something else: The composite has dished out a 22% gain from the late-December low, and wasn’t ever really checked on the way up. Even as rough as the October-December meltdown was, it at least took a couple of breaks in there.
NASDAQ Composite Weekly Chart, with Volume

Source: TradeStation
And for what it’s worth, though not shown on any chart here, the S&P 500’s daily chart just signaled a bearish divergence of the MACD indicator. More on that next time.
Despite Friday’s victory, stocks are still uncomfortably vulnerable here. Yet, the technicals matter a little less now than they usually might. This is still a market being largely driven by headlines – and political headlines in particular – and we have to be prepared for anything. Most of all we need to be prepared to respond to what the market IS doing rather than what we think it should be doing. Strange days indeed.
— Price


