Weekly Market Outlook – That Was a Reversal Signal, But a Stimulus-Induced One
Weekly Market Outlook – March 29th, 2020
This week starts with a look at the weekly chart of the S&P 500, as in this timeframe we see a pretty compelling glimmer of hope. Here we see a close above the previous week’s open, and an open below the previous week’s open…. with the latter of the two weeks pointed in the opposite direction (higher). This so-called “engulfing bar” indicates a sudden and sweeping change of heart among traders. More important, these is the kind — and placement — of bar one would expect to see when a major reversal gets going. This one, hopefully, will be the V-shaped reversal we hope it is.
S&P 500 Weekly Chart, with VIX and Volume
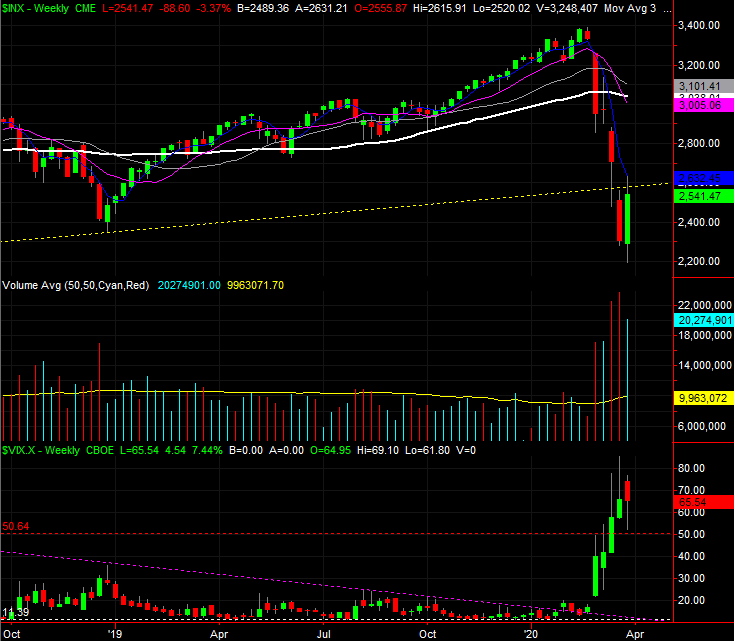
Source: TradeStation
Zooming into the daily chart adds some detail to the weekly chart. Namely, in the shorter-term timeframe we can see the rally effort was stopped abruptly on Friday as we got close to the 20-day moving average line (blue). But, we can also see Friday’s sizeable loss was a low-volume matter, meaning most people were sticking with most stocks they bought over the course of the prior three trading days. In fact, even for the folks hoping for and expecting more upside, Friday’s lull may ultimately serve as a much-needed reset of the advance.
S&P 500 Daily Chart, with VIX and Volume
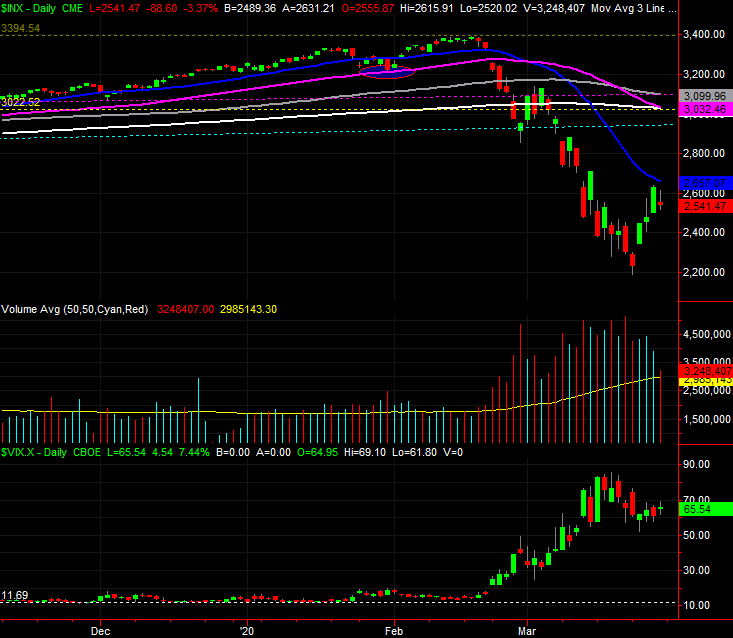
Source: TradeStation
The same “outside day” bar — for the week — applies to the NASDAQ Composite, but there’s a more important nuance of the NASDAQ’s weekly chart we want to point out today.
You may recall several days ago we plotted Fibonacci retracement lines for the NASDAQ’s weekly chart, explaining the 6528, 38.2% retracement of the entire bull market looked like the most plausible “enough is enough” point for the index. The composite fell to 6631 last week, which may well be close enough to count as a full Fibonacci retracement. You can also (still) see the VXN almost kissed a record high of just under 90 two weeks ago, suggesting fear-based selling has peaked.
NASDAQ Composite Weekly Chart, with VXN
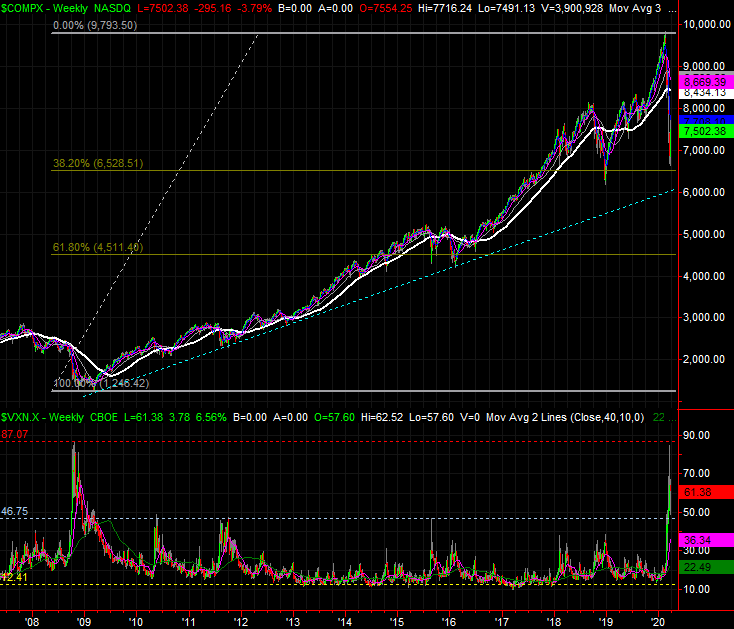
Source: TradeStation
Zooming into the daily chart of the NASDAQ Composite tells the same basic story as the S&P 500’s. That is, the 20-day moving average line (blue) at 7775 may be something of a test, and there wasn’t a ton of volume behind Friday’s stumble. The NASDAQ also shows us something else that applied to the S&P 500 though… the big bullish gap left behind by Tuesday incredibly strong opening. Generally speaking, the market doesn’t like to leave gaps unfilled, meaning the index may be pressured lower to fill it in before it resumes the rally. Problem is, if stocks start to lose that kind of ground again, that may strike new fear into the hearts of investors, jump-starting a selloff that takes stocks to new lows.
NASDAQ Composite Daily Chart, with VXN
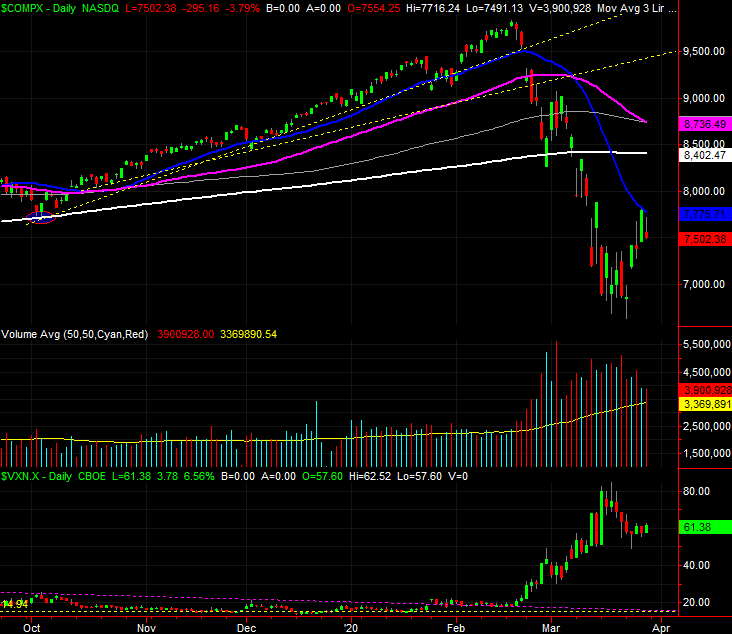
Source: TradeStation
With all of that being said, anything is possible from here, with the COVID-19 situation firmly in control of perception, reality, and assumptions about the future. The market is oversold and undervalued, and though not tomorrow, the coronavirus outbreak will abate. The economy, companies, and consumers are in good position to drive a recovery once one can begin. But, fear could easily cause selling in the immediate future, at the drop of a hat. Keep playing it close to the vest, and don’t dig in too deep… on either side of the fence.