Weekly Market Outlook – Did Triple-Witching Paint a Misleading Picture?
Take all of last week – both the good and the bad – with a grain of salt. Not only was Friday a triple-witching day that may have skewed (or contained) the bullish trend up until then, last week’s bullishness also tested late-April’s then-record high. This is where indecision and confusion should kick in.
Regardless, where we ended last week is where we have to start this week’s trading, leaving investors asking if June’s incredible bullishness to-date is the shape of things to come, or just a setup for an equally impressive rush of profit-taking.
We’re cautiously leaning towards the latter. Although the market has been able to continue rallying after gains like the 7.2% advance logged over the course of the past three weeks, in most of those cases the S&P 500 had the advantage of starting such a move out from deep in the hole. This time around, the effort is taking shape after a very modest dip following an incredible 23% rally between late December and late April. The weekly chart is still technically overbought from that move.
S&P 500 Weekly Chart, with Volume
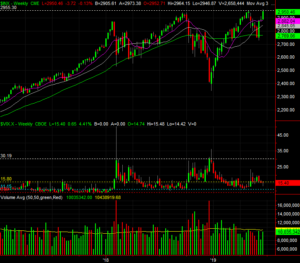
Source: TradeStation
Zooming into the daily chart of the S&P 500 provides us a more detailed, albeit tainted, look at things. Namely, we can see on Friday that traders were making a (expiration-motivated?) effort to hold the line right at 2950, which is essentially where the index peaked in April. It’s on the daily chart we can just how incredible – and odd – this month has been. The S&P 500 is now 6.3% higher than its 200-day moving average line, which is about the maximum divergence it’s been historically capable of making.
S&P 500 Daily Chart, with VIX, Volume
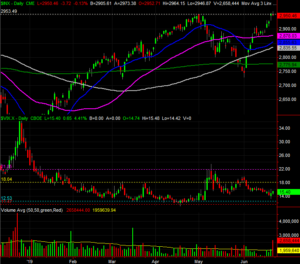
Source: TradeStation
It’s also the daily chart, however, that shows us what to pay the most attention to from here.
Although it was undoubtedly skewed by last week’s sweeping expiration of options and futures, the VIX has drawn some important lines in the sand. The one we’re eying from here is right around 18.0, where it peaked a couple of times in February and March, though we’re going to go ahead and mark the 22.0 area as the absolute ceiling. If the 22.0 area is reached and then breached though, then the S&P 500 has already suffered a pretty good blow.
A good blow doesn’t inherently mean a death blow, however. All four key moving averages are now below the index, and each could serve as a technical floor in the case of the stumble. Chief among them, of course, is the 200-day moving average line at 2776… the same 200-day average line that failed to act as a floor in late May, and still didn’t act as a great sell signal.
Headlines sidestepped that potential stumbling block. To that end, we’re still just one headline away from another breakout move, or a breakdown. Don’t put ALL your faith in reading the clues available with charts.
As for the NASDAQ, the same basic story applies, though the composite hasn’t been able to even retest its April peak yet. That in itself is a concern, as healthy uptrends tend to be led by the tech-heavy NASDAQ Composite.
NASDAQ Composite Daily Chart, with VXN, Volume
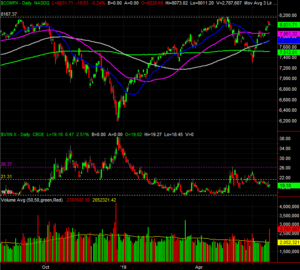
Source: TradeStation
With that as the backdrop, we again can’t stress enough to assume nothing, and keep your eyes peeled. This is a wildly unusual environment.
First and foremost is the scope of the volatility we’ve seen since the beginning of the year. A close-second is the degree of gains we’ve seen this month. June is usually little better than a breakeven. This year, June’s 7% gain undoes an effort to get the broad market back on a more typical track given the meltdown suffered during the final quarter of last year.
S&P 500 Daily Average Cumulative Performance
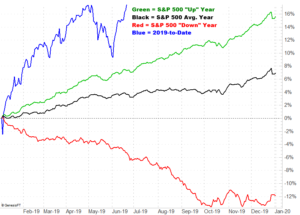
Source: TradeNavigator
It’s a concern, simply because if the S&P 500 is going to return to the norm, or mean, it’s only going to do so with a sizeable setback.
This remains a day-by-day exercise.
-Price