Weekly Market Outlook – Losing Speed at the End of the Runway
Even with just a quick glance at the weekly chart of the NASDAQ Composite, the market’s problem becomes clear – too much, too fast, with fading buying interest the higher stocks go. Volume was going to be poor no matter what.
NASDAQ Composite Weekly Chart, with Volume
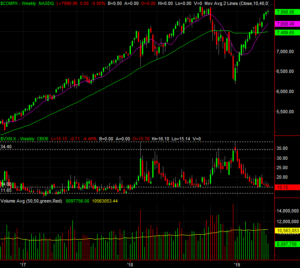
Source: TradeStation
Even the one relieving aspect of the NASDAQ’s chart isn’t all that relieving. That’s the VXN. It’s not yet back to its absolute floor around 11.8, but last week’s low of near 15.0 is still a major technical support level in and of itself. Reaching that market doesn’t necessarily mean the market can’t keep on climbing. But, it does make it tougher to do so.
Zooming into the daily chart of the NASDAQ we don’t learn a whole lot more, but we do gain some clarity on how the rally is slowing down. We also know exactly where any pullback is apt to find support. Any of the moving average lines in the rearview mirror could quell any selling.
NASDAQ Composite Daily Chart, with Volume
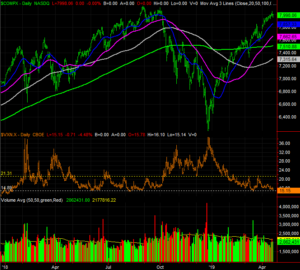
Source: TradeStation
The same goes for the S&P 500’s daily chart.
S&P 500 Daily Chart, with Volume
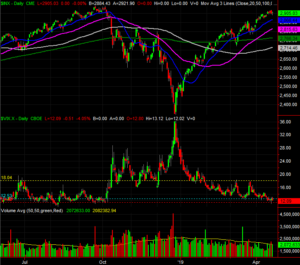
Source: TradeStation
The flaw, and fly in the ointment, as volume… or more specifically, a lack of bullish volume. The relative number of advancers (compared to decliners) isn’t terribly impressive either.
Though not exceedingly so, the recent bullish volume has been below average, while the bearish volume has been above the recent average. The market itself hasn’t lost ground, but depth and breadth – volume and advancers/decliners – usually change direction before the market tide does. A few more days of the same would become a net-bearish condition. We’ll talk more about that shift to net-bearish depth and breadth if and when the time comes.
S&P 500 Daily Chart, with NYSE Advancers, Decliners, Up and Down Volume
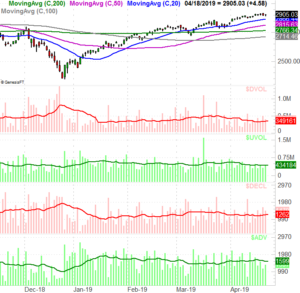
Source: TradeStation
Bottom line? The market isn’t in more trouble than it can handle yet. It’s not even in a profit-taking mode though it arguably should be. It may not be a buy, but it’s certainly not yet a sell. Still, it’s curious that the rally effort is slowing down as new highs come into sight; the rally back to peak levels from December’s deep low was relatively easy. Stocks are running out of runway, but the wheels aren’t off the ground yet, and airspeed is slowing.
The key is still the VIX and the index’s moving average lines. The VIX would need to break above its recent ceiling around 18.0, while the S&P 500 would need to start breaking under its moving average lines to even consider trading a selloff. In the meantime, if Q2’s earnings and industrial productivity don’t perk up, a small blip could become more serious. First things first though.
This remains a day-to-day affair. Headlines are still mostly in charge, though less so now that stocks are strained under the weight of big gains.
-Price