Weekly Market Outlook – The Impossible Rally is Clearly Possible
It’s amazing, but the market find a way to sidestep what looked to be an inevitable correction a week ago to push its way to another record high. Last week’s 1.65% advance translates into a 10% gain in just the past eight weeks, and the S&P 500 is now up nearly 29% from its late-2018 low. Granted, it started that run out deep in the hole, but still…. an amazingly big advance in just seven months’ time.
Like last week, the move leaves the broad market overbought and quite ripe for a pullback, particularly at a time of year when stocks don’t perform all that well. Investors have remained in a buying mood for as long as they’ve been strung along by the Fed’s “we’ll do something soon” message in addition the “the tariff war will end soon” backdrop. Neither has happened yet, but that’s not impeded any buying.
Now, both events are actually within reach. The market’s betting on a quarter-point rate cut later this week that the FOMC has all but assured us it will be dishing out.
The weekly chart of the S&P 500 puts it all in perspective.
S&P 500 Weekly Chart
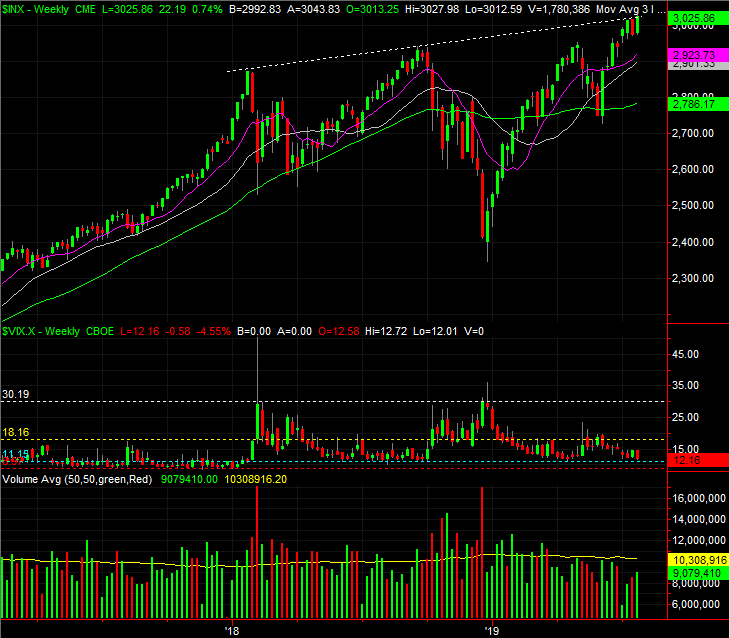
Source: TradeStation
The weekly chart, however, also highlights a problem for the rally we mentioned earlier in the month – even with the recent strength, the S&P 500 is struggling with a technical resistance line that extends all the way back to the early-2018 peak. The same weekly chart also shows the VIX is hovering near absolute lows, which often occurs at major market highs.
Zooming into a daily chart we can see the simplest of explanations for last week’s surprise reversal. All it took was a kiss of the 20-day moving average line (blue) to rekindle the rally that’s been in place since early June.
S&P 500 Daily Chart, with VIX, Volume
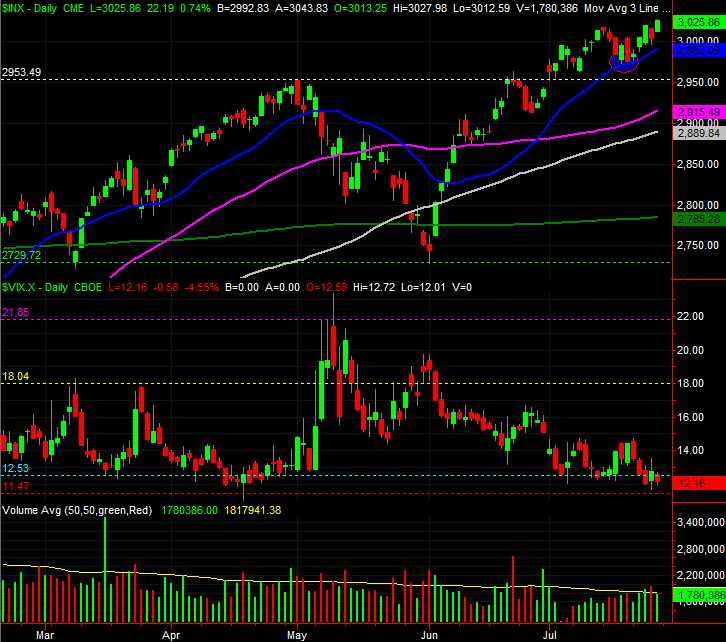
Source: TradeStation
The same basic facts apply to the NASDAQ Composite’s chart, though with one key exception. As the weekly chart of the composite shows, it was able to push through the resistance line the S&P 500 couldn’t. Also note that the NASDAQ’s volatility index, the VXN, is pressing into an even-better established horizontal floor just under 15.0. There’s not a whole lot of room left for more upside, even if stocks manage to squeeze out a little more bullishness.
NASDAQ Composite Weekly Chart, with VXN, Volume
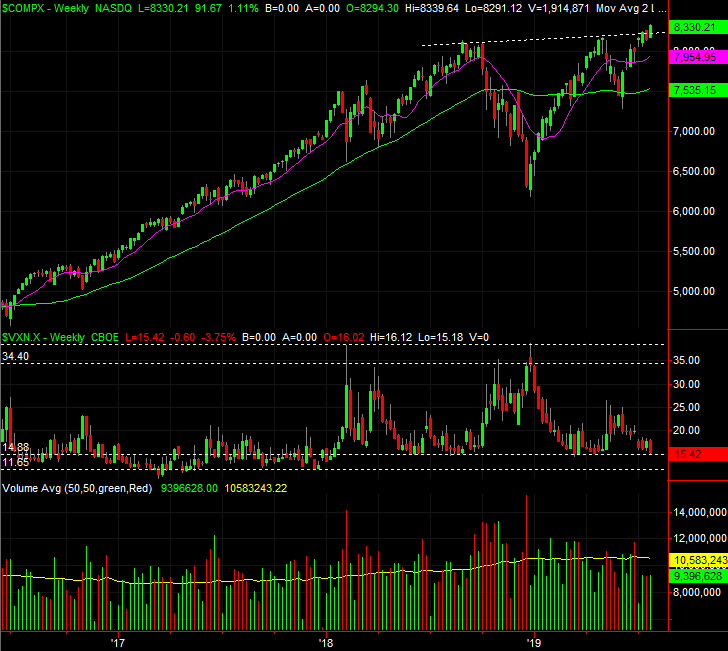
Source: TradeStation
Or, perhaps there is. Though traders have already priced in the impact of a rate cut, they may well price one in again once (or if) they actually get it.
And for the record, the S&P 500 is now 8.6% above its 200-day moving average line. That’s above the average maximum divergence we’ve historically seen between the index and its long-term moving average.
The momentum is admittedly impressive, but difficult to trust here. It’s rare that it last this long. One can’t also help but wonder is the widely-expected rate cut will turn into a ‘sell the news’ situation.
Whatever’s in the cards, any pullback will have to break under the 20-day moving average line at 2992 is it’s to have any credibility. It will have to fall under the 2900 area, where a couple of other key moving averages currently lie, to say it could even have a shot at turning into a full-blown correction. That situation would also have to include the VIX breaking above a ceiling around 18.0 before any new bearish assumptions can even start to be entertained.


1 Comment
wanted to sign up for special offer of $7 from 8/14 webinar.