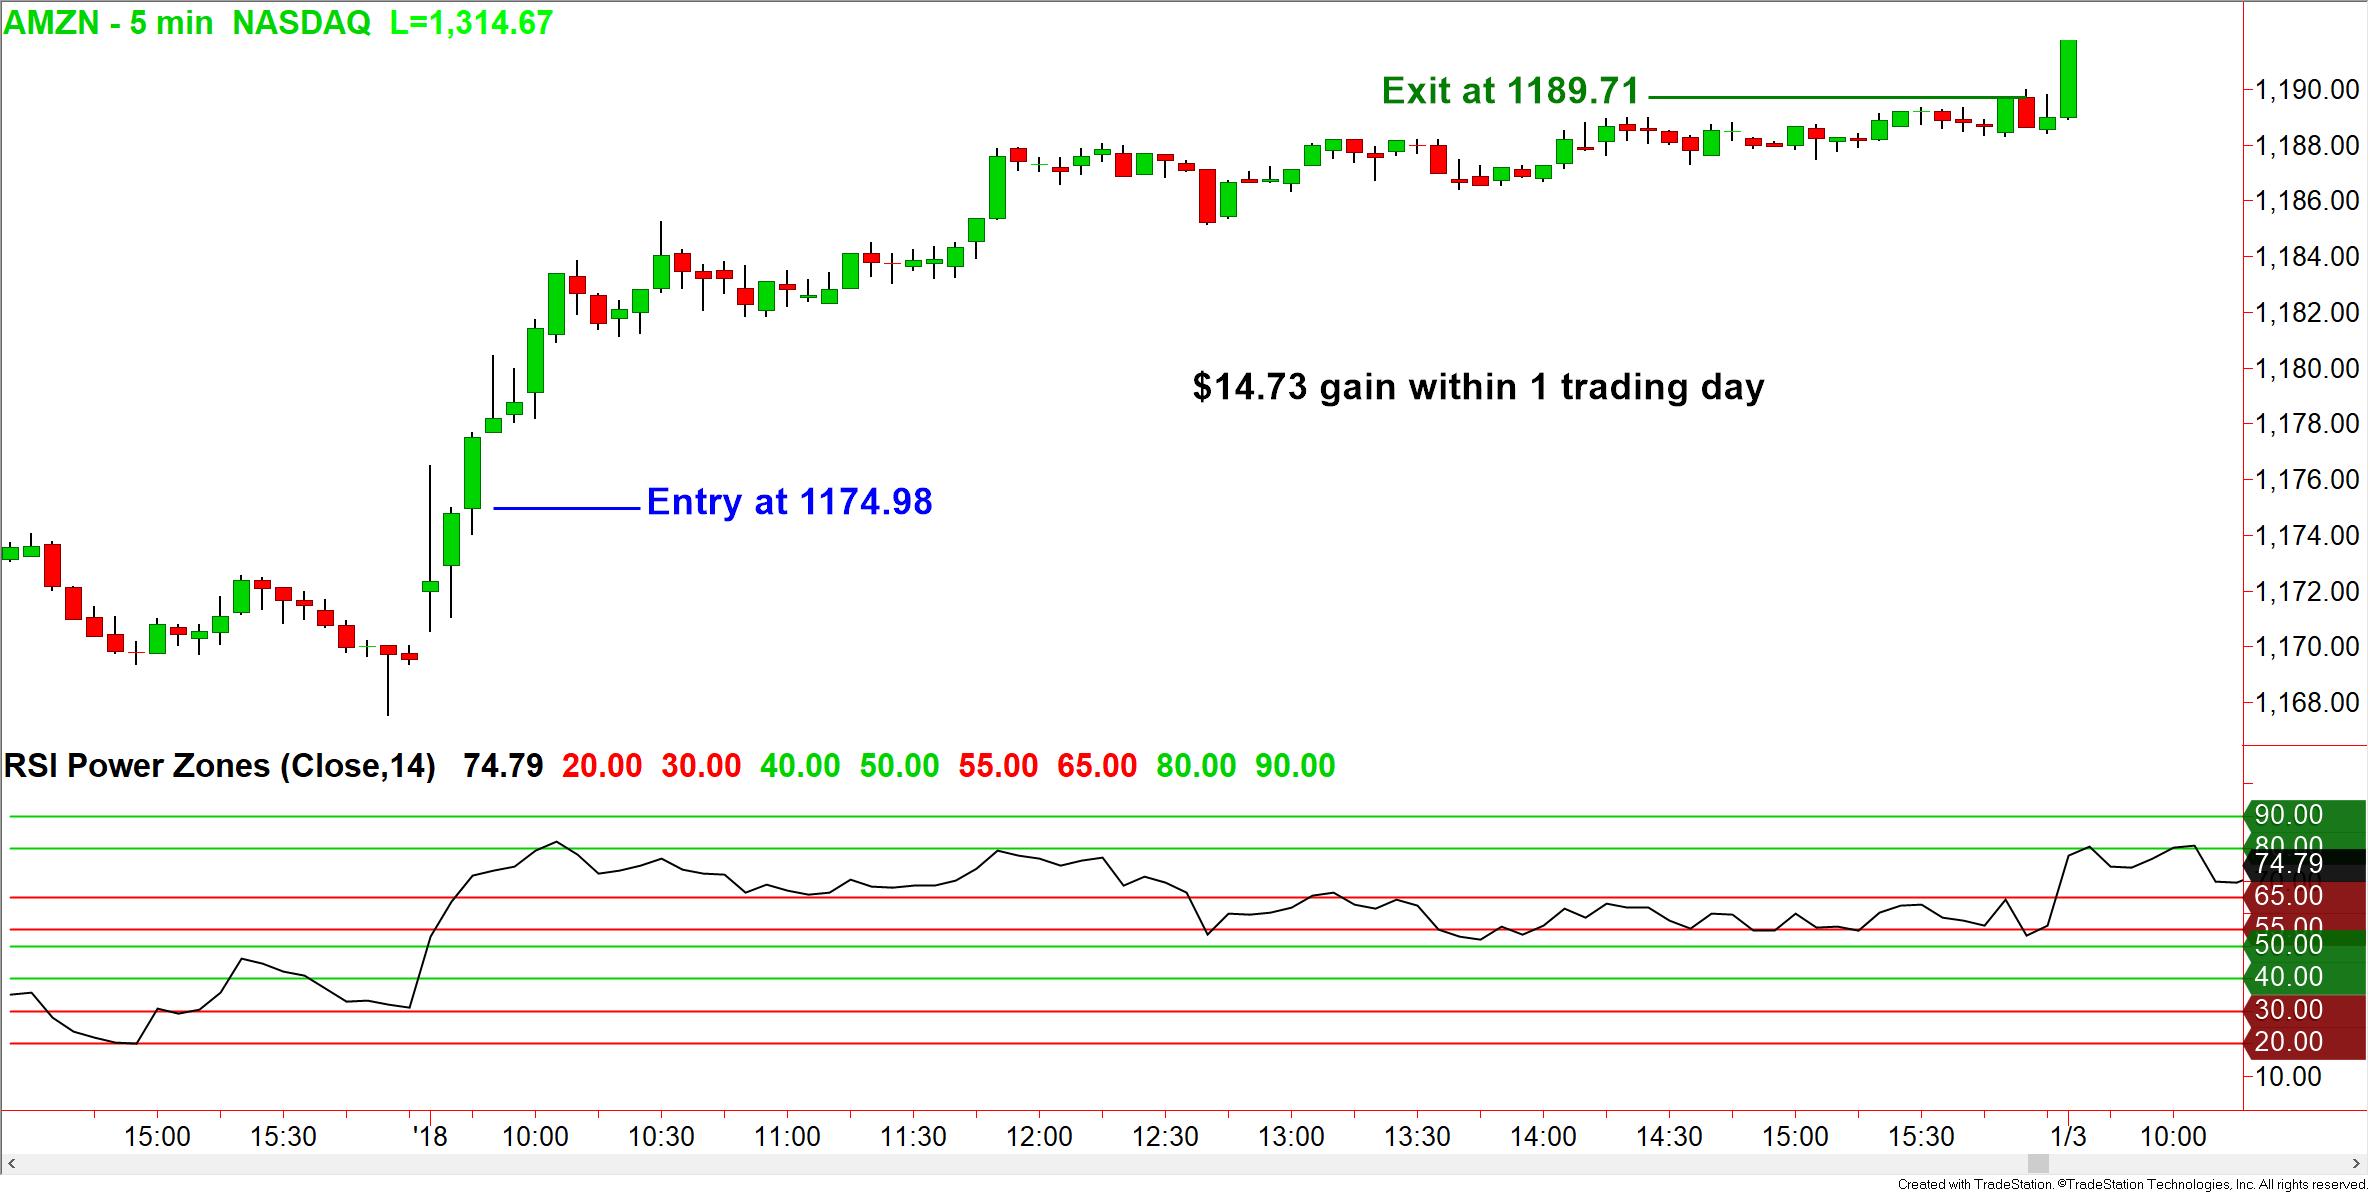
The RSI Power Zones Indicator
Brought to You by Hima Reddy
- The RSI Power Zones Indicator makes the most of the popular Relative Strength Index momentum indicator.
- By delineating key “zones” of bullish and bearish support and resistance, traders can use the RSI in trending markets along with the traditional range-trading approaches.
- The RSI Power Zones Indicator can be applied to a chart of any active and liquid market in any time frame.
- Save time and effort! Get this indicator which automatically plots the zone lines. This will make your application of Hima’s strategies around this indicator WAY simpler!

“My FIRST month using RSI Power Zones was also my BEST trading month so far!”
Susie M.
Colorado
Available for a variety of platforms:
TradeStation, ThinkOrSwim, NinjaTrader 8, NinjaTrader 7, eSignal, Ensign, MetaTrader 4, MetaTrader 5, Sierra Chart, TradeNavigator, TradingView
Get Your Indicator Today
Regularly Priced $297
Limited Time Offer
CFTC RULE 4.41 – HYPOTHETICAL OR SIMULATED PERFORMANCE RESULTS HAVE CERTAIN LIMITATIONS. UNLIKE AN ACTUAL PERFORMANCE RECORD, SIMULATED RESULTS DO NOT REPRESENT ACTUAL TRADING. ALSO, SINCE THE TRADES HAVE NOT BEEN EXECUTED, THE RESULTS MAY HAVE UNDER-OR-OVER COMPENSATED FOR THE IMPACT, IF ANY, OF CERTAIN MARKET FACTORS, SUCH AS LACK OF LIQUIDITY. SIMULATED TRADING PROGRAMS IN GENERAL ARE ALSO SUBJECT TO THE FACT THAT THEY ARE DESIGNED WITH THE BENEFIT OF HINDSIGHT. NO REPRESENTATION IS BEING MADE THAT ANY ACCOUNT WILL OR IS LIKELY TO ACHIEVE PROFIT OR LOSSES SIMILAR TO THOSE SHOWN.

